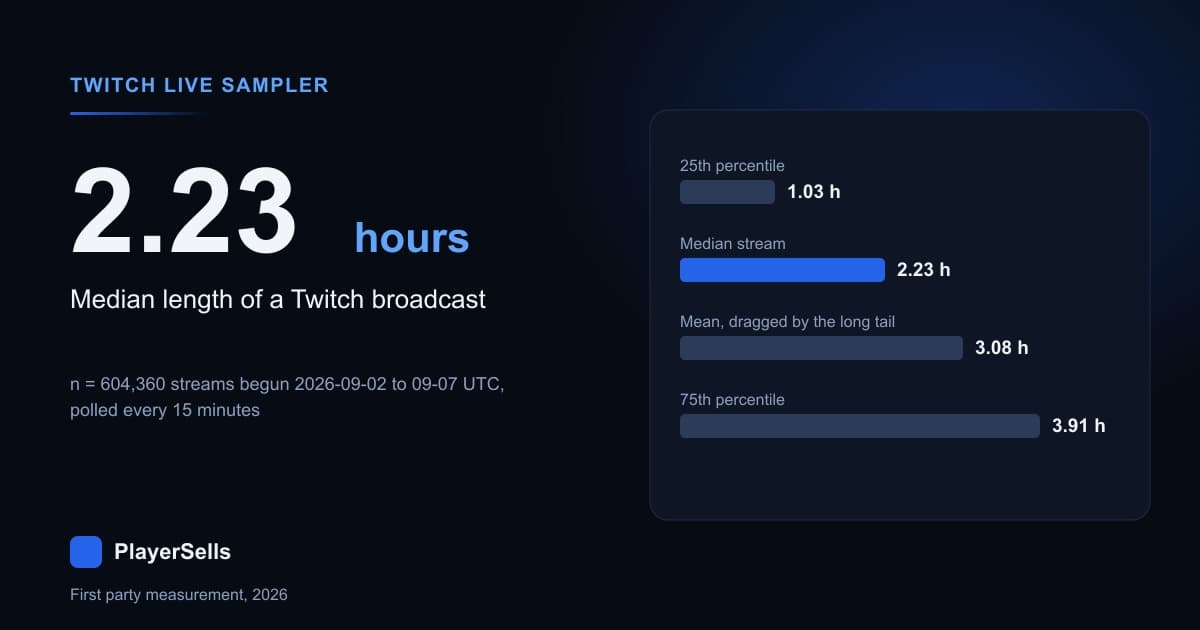
The median Twitch stream ran 2.23 hours in September 2026, measured across 604,360 broadcasts that began between 2026-09-02 and 2026-09-07 UTC and were polled every 15 minutes by our own Twitch crawl engine. A quarter of them were over inside 1.03 hours. Only 5.20% passed the eight hour mark. That is the whole distribution in three numbers, and it is a good deal shorter than the marathon folklore around streaming would suggest.
The second question a seller or a buyer actually asks is whether the extra hours pay for themselves. Comparing each channel's own longer sessions against its own shorter ones, across 33,933 channels that streamed at least four times in that window, sessions running 2.19x longer carried a median 1.22x the peak concurrent viewers. Twice the hours, about a fifth more peak audience. Length pays, but sublinearly, and the naive cross-sectional version of the same comparison exaggerates the payoff by more than ten times.
How long does a Twitch stream actually run?
Our Twitch engine wrote 7,726,485 live samples between 2026-09-01 12:57:57 UTC and 2026-09-08 12:56:09 UTC, which is exactly seven days of coverage spread over eight calendar dates. From that we isolated every broadcast that began inside the five day span 2026-09-02 to 2026-09-07: 604,542 distinct stream ids. Only 182 of them (0.03%) were still live when we cut the analysis, leaving 604,360 finished broadcasts from 320,024 channels, so censoring does no work in the numbers below.
Duration here means the interval from the platform-reported started_at to the last time our sampler saw the stream alive. The distribution is heavy-tailed: the mean of 3.08 hours sits well above the median of 2.23 hours, the usual sign that averages will mislead you. The table below carries the count in every row, so you can rebuild any percentile.
| Session length | Streams | Share of 604,360 |
|---|---|---|
| Under 15 minutes | 36,308 | 6.01% |
| 15 to 30 minutes | 37,933 | 6.28% |
| 30 to 60 minutes | 73,167 | 12.11% |
| 1 to 2 hours | 127,648 | 21.12% |
| 2 to 3 hours | 106,740 | 17.66% |
| 3 to 4 hours | 77,907 | 12.89% |
| 4 to 6 hours | 81,216 | 13.44% |
| 6 to 8 hours | 32,038 | 5.30% |
| 8 to 12 hours | 20,453 | 3.38% |
| 12 to 24 hours | 7,394 | 1.22% |
| 24 hours or more | 3,556 | 0.59% |
Read the cumulative figures and the picture sharpens. 45.51% of streams finished inside two hours. 76.06% finished inside four. The 3,556 broadcasts that ran past 24 hours are 0.59% of the sample, and they shape the public image of the platform while representing roughly one stream in 170. The median held steady day by day too: 2.204, 2.194, 2.244, 2.265 and 2.226 hours for the five birth dates, a spread of 4.3 minutes.
Why does one day of data cut the answer short?
Our live samples are stored one table per UTC day. A stream that starts at 22:00 and runs to 02:00 lands half its samples in one table and half in the next, so anybody reading a single day gets a truncated stream. We solved this by grouping on stream_id across the whole partitioned parent rather than inside one day, which stitches the halves back together. Verifying the stitch first: not one of the 604,542 stream ids mapped to more than one channel or to more than one started_at, so the id is safe to group on.
The cost of getting this wrong is measurable. Of the 123,201 broadcasts that began on 2026-09-05 UTC, 17,825 (14.47%) were still live at midnight, with 59.85% of their samples in the following day's table. Here is what a single-day read does to the answer.
| Statistic, streams born 2026-09-05 | Stitched across days | Single day table only | Understated by |
|---|---|---|---|
| Median length | 2.265 h | 2.014 h | 15.1 min |
| 75th percentile | 4.065 h | 3.626 h | 26.3 min |
| 90th percentile | 6.490 h | 5.550 h | 56.4 min |
| Mean length | 3.205 h | 2.626 h | 34.7 min |
| Median, midnight-crossing streams only | 4.958 h | 2.446 h | 2 h 31 min |
An 11.1% error in the headline median is bad enough. The row that matters more is the last: a stream that crosses midnight loses half its measured length, so the naive method does not shave the distribution evenly, it amputates the long streams. Any published Twitch duration figure that does not say how it handled the day boundary should be treated as a floor. Across our full five day cohort, 61,624 streams (10.19%) crossed 00:00 UTC.
Does session length track channel size?
It tracks it closely. We joined each stream to our Twitch directory of 434,988 channels on user_id and matched 604,350 of 604,360 streams, a 99.998% match rate, so the size bands below are effectively the whole cohort rather than a subset. Follower counts come from the same directory that powers our public listing of the largest Twitch channels by followers.
| Follower band | Channels | Streams | 25th pct | Median | 75th pct | 90th pct |
|---|---|---|---|---|---|---|
| Under 10 | 46,615 | 75,392 | 0.35 h | 0.83 h | 1.69 h | 2.93 h |
| 10 to 99 | 91,794 | 163,858 | 0.73 h | 1.56 h | 2.83 h | 4.43 h |
| 100 to 999 | 113,496 | 213,276 | 1.43 h | 2.59 h | 4.10 h | 6.19 h |
| 1,000 to 9,999 | 50,377 | 105,161 | 2.01 h | 3.34 h | 5.15 h | 7.72 h |
| 10,000 to 99,999 | 13,989 | 35,500 | 2.25 h | 3.85 h | 5.94 h | 8.77 h |
| 100,000 or more | 3,743 | 11,163 | 2.61 h | 4.39 h | 6.70 h | 9.93 h |
A channel with 100,000 followers or more runs a median session of 4.39 hours, 5.26x the 0.83 hours of a channel under 10 followers. The gradient is monotonic across every band and every percentile. What the table cannot tell you is direction: whether long sessions grew those channels, or whether an existing audience makes four hours easier. The within-channel test below is the closest we can get.
What happens to viewers inside a stream?
Streams build. They do not decay. We took the 49,895 broadcasts born on 2026-09-05 that we caught at least eight times, normalised every stream to its own first observed viewer count, then cut each stream into ten equal slices of its own elapsed length. Normalising per stream is what stops a handful of very large channels from writing the curve for everybody.
| Position in the stream | Streams | Median viewers vs first sighting |
|---|---|---|
| First 10% | 49,895 | 1.00x |
| 10 to 20% | 47,092 | 1.20x |
| 20 to 30% | 47,082 | 1.29x |
| 30 to 40% | 42,992 | 1.36x |
| 40 to 50% | 45,140 | 1.38x |
| 50 to 60% | 44,728 | 1.42x |
| 60 to 70% | 43,099 | 1.45x |
| 70 to 80% | 47,213 | 1.43x |
| 80 to 90% | 47,481 | 1.43x |
| Final 10% | 49,895 | 1.38x |
The median stream is carrying 45% more viewers two thirds of the way in than it had at its first sighting, and it is still 38% up in its closing slice. Nothing in this design creates that shape by itself: every stream contributes exactly one observation to every slice, because the slices are fractions of that stream's own length. The plausible mechanism, and this part is inference rather than measurement, is that Twitch discovery and viewer word of mouth both take time to find a live channel.
Is the rise real, or a small-number artifact?
Small numbers were our first worry. Most channels in the cohort open with a single-digit viewer count, and ratios built on tiny integers behave badly. So we split the same 49,895 streams by how many viewers they had at first sighting and re-ran the curve inside each band. If the rise were arithmetic noise it would collapse on the large channels.
| Viewers at first sighting | Streams | First 10% | Peak slice | Final 10% |
|---|---|---|---|---|
| 1 to 4 | 24,072 | 1.00x | 1.50x | 1.50x |
| 5 to 19 | 14,880 | 1.00x | 1.40x | 1.35x |
| 20 to 99 | 7,223 | 1.03x | 1.42x | 1.36x |
| 100 or more | 3,720 | 1.05x | 1.40x | 1.31x |
It does not collapse. Channels opening with 100 or more concurrent viewers, where a one-viewer wobble changes nothing, show the same climb to roughly 1.40x and the same modest fade to 1.31x by the end. The only visible difference by size is that bigger rooms shed slightly more of their peak in the closing slice, 1.31x against 1.50x for the smallest band. The shape is a property of live broadcasts, not of our arithmetic.
Our crawl design was the second worry, and a real one. The sampler walks the Twitch category list and takes roughly the top thirty live streams in each category per sweep, so a stream can drop off that shelf as its viewers fall, clipping the bottom off its own tail. On 2026-09-05 the cap bound in 16,301 of 104,533 category-sweep cells, but the thirtieth stream in a capped cell held a median of 2 viewers and 59,797 of 135,840 streams never met the shelf at all. Split the curve on that line and it does not move: a 1.50x peak either way.
Where does a stream peak?
Late, and then it plateaus rather than crashing. To put the answer in clock time instead of percentages we took only streams whose total length fell between four and five hours, so that every stream in the group contributes to every hour and no survivor effect can tilt the curve. Within that fixed-length group the peak lands in the fourth hour.
| Hour of a 4 to 5 hour broadcast | Streams | Median viewers vs first sighting |
|---|---|---|
| Hour 1 | 6,294 | 1.17x |
| Hour 2 | 7,179 | 1.33x |
| Hour 3 | 7,653 | 1.40x |
| Hour 4 | 7,695 | 1.48x |
| Hour 5 | 7,788 | 1.44x |
Hour one is the weakest hour of a four hour stream, by a wide margin. A streamer who goes live, plays for 50 minutes and logs off quits where the audience curve is still climbing. Counts differ per row because a stream first sighted after hour one contributes no hour one observation.
Does streaming longer actually earn more viewers?
Yes, and by much less than the industry line implies. The only honest way to ask is within a single channel, so we took the 33,933 channels that ran at least four sessions in the five day window, split each channel's own sessions into its longer half and its shorter half, and compared. The channel is its own control, which removes every difference between channels in one step.
| Within-channel comparison | Channels | Median peak-viewer ratio | Share where the longer half peaked higher |
|---|---|---|---|
| All channels with 4 or more sessions | 33,933 | 1.22x | 62.92% |
| Channels whose shorter half peaked at 10 or more | 14,355 | 1.14x | 68.53% |
| Channels whose shorter half peaked at 100 or more | 4,388 | 1.10x | 66.13% |
| Single longest session vs single shortest session | 31,075 | 1.00x (integer tie) | 66.93% |
For the full set the longer half ran a median 3.88 hours against 1.77 hours: a 2.19x difference in length for a 1.22x difference in peak viewers. Restricted to channels whose viewer counts are large enough that small integers do not quantise the ratio, the longer half ran 5.30 hours against 2.89 hours, 1.84x, for a 1.14x peak. Both pairs put the elasticity between 0.22 and 0.26, so a doubling of session length maps to roughly 16% to 20% more peak concurrent viewers. The fourth row is why we lead with the half-split: on two single sessions the median ratio lands exactly on 1.00, while the sign test still says 66.93% went up.
One result in that analysis matters more than the ratios. The median ratio of opening viewers between a channel's longer and shorter halves was exactly 1.0000, and only 46.20% of channels opened their longer sessions with a bigger audience than their shorter ones. Long sessions are not the days when a bigger crowd was already waiting. Whatever extra audience a long stream ends up with, it accumulates during the broadcast. That is the strongest argument in this dataset that the length is doing some of the work, though we cannot rule out the reverse: a streamer with a full room has every reason to keep going.
The cross-sectional answer overstates the payoff by ten times
Pool every stream together, ignore which channel it came from, and the same question gives a wildly different answer. Sorting those streams into length bands and taking the median peak viewers in each produces a gradient that looks like a growth strategy. The count here is 604,356 rather than 604,360 because four streams picked up a late sample between our two runs.
| Session length | Streams | Median peak concurrent viewers |
|---|---|---|
| Under 1 hour | 147,408 | 2 |
| 1 to 2 hours | 127,648 | 4 |
| 2 to 4 hours | 184,647 | 7 |
| 4 to 6 hours | 81,216 | 14 |
| 6 to 8 hours | 32,038 | 19 |
| 8 hours or more | 31,399 | 21 |
Streams of eight hours or more carry 10.5x the median peak of streams under an hour. Set that against the 1.10x to 1.22x we measured inside the same channel and the gap is the finding. The cross-sectional table is mostly a statement about who streams for eight hours, and the size table earlier already told you: people with audiences. If you see a chart claiming long streams get many times more viewers, check whether anyone held the channel constant. Same data, cut two ways, answers an order of magnitude apart.
What our sampler cannot see
Every number above is measured to the last sighting, not to the true end of the broadcast, and the honest thing is to quantify that gap rather than wave at it. Across the cohort the median interval between consecutive samples of the same stream was 15.006 minutes, the 90th percentile 21.01 minutes and the 99th 66.34 minutes, with 77.37% of multi-sample streams polled at an average of 16 minutes or better. The cadence is tight, which is what makes the duration figures usable.
Three consequences follow, each pushing in a known direction. The true end of a stream sits between our last sighting and one sweep later, so every duration here understates the truth by a mean of about 7.5 minutes, putting the real median nearer 2.35 hours. A broadcast that starts and finishes inside one 15 minute gap is invisible to us, so the 36,308 streams we logged under 15 minutes are a floor and the true median is at or below what we report. And 86,773 streams (14.36%) were seen exactly once, so their length is bracketed rather than pinned.
The lag between the platform-reported start and our first sighting had a median of 16.4 minutes and a 90th percentile of 127.4 minutes, which is why we anchor duration on started_at rather than our own first sample. Anchoring on our own sightings instead, first to last plus one sweep for the unobserved tail, moves the median to 1.75 hours, which brackets the same quantity from the opposite side.
How does Kick compare?
Kick sessions run shorter, but part of that gap is our own instrument and we will not pretend otherwise. Our Kick engine polls on a slower cycle, so its unobserved tail is longer and its share of once-seen sessions is higher. Both engines started writing on 2026-09-01 and cover the same seven day window, so the comparison is at least contemporaneous. The same stitching applies: session_id on Kick is likewise unique to one channel and one start time, with zero violations across 491,392 sessions.
| Measure, 2026-09-02 to 2026-09-07 UTC | Twitch | Kick |
|---|---|---|
| Sessions in the cohort | 604,360 | 491,392 |
| 25th percentile length | 1.03 h | 0.57 h |
| Median length | 2.23 h | 1.64 h |
| 75th percentile length | 3.91 h | 3.26 h |
| 90th percentile length | 6.13 h | 5.65 h |
| Median gap between our samples | 15.01 min | 20.08 min |
| Sessions seen exactly once | 14.36% | 20.43% |
| Sessions crossing 00:00 UTC | 10.19% | 12.11% |
The raw median gap is 35 minutes. Correcting each platform for its own half-sweep of unobserved tail closes about 2.5 minutes of it, so roughly half an hour survives the correction. We would not push it further on seven days of data. If you want the audience side of the same comparison rather than the clock side, our write-up of how Kick and Twitch compare on actual viewership covers it, and the gap between follower counts and concurrent viewers explains why the two metrics disagree so often.
What a buyer or a seller should take from this
Stream hours are the part of a channel that does not transfer. A buyer inherits the followers, the archive and the category history, but the 4.39 hour median session of a 100,000-follower channel was produced by a person, and the new owner has to produce it again or watch the numbers drift. That is why we push people toward the Twitch channel value estimator before they anchor on a follower count.
For sellers the practical read is the trajectory table. If your median session is under two hours you are consistently ending broadcasts before the audience curve tops out in the fourth hour, and the 1.22x within-channel figure says extending is worth something real but not transformative. Model it with the Twitch revenue calculator rather than assuming doubling hours doubles anything. Buyers evaluating a listing on our account marketplace should ask for session history, not peak viewer screenshots: a single 12 hour charity stream sits in the 0.59% tail and says nothing about a normal week.
If you want a channel with a live audience rather than a dormant follower list, our Twitch channels with active viewers and Kick channels with active viewers pages set out what we escrow, though we should say plainly that streaming supply is thin: of 435 active listings on 2026-09-08, one was a Kick channel and none were Twitch. Our Twitch channel benchmarks across 107,000 channels give the viewer distribution to price against. Everything here was measured on seven days: a sharp snapshot of September 2026, not a law.
Questions about Twitch stream length
What is the average length of a Twitch stream?
The median is 2.23 hours and the mean is 3.08 hours, measured across 604,360 broadcasts that started between 2026-09-02 and 2026-09-07 UTC in our own crawl. Use the median. The distribution is heavy-tailed, with 0.59% of streams running past 24 hours, and those few pull the mean up by 38% relative to the median without describing a typical broadcast at all.
How long should I stream to grow?
Our data says the audience curve is still climbing in the fourth hour of a four to five hour broadcast, peaking at 1.48x the opening count, so sessions under two hours end early relative to that curve. It also says the payoff is sublinear: within the same channel, 2.19x the hours came with 1.22x the peak viewers across 33,933 channels. Longer helps, but it does not scale one for one.
Do Twitch viewers drop off during a long stream?
Not in the median case. Across 49,895 streams sampled at least eight times, viewership rose to 1.45x the first sighting around the 60 to 70% mark and was still 1.38x in the closing slice. Channels opening with 100 or more viewers fade slightly more, ending at 1.31x, but every size band we measured finished above where it started.
Is a long stream evidence that a channel is worth more?
Only weakly, and mostly in the other direction. Pooled across all 604,356 streams, eight hour broadcasts show 10.5x the median peak of sub-hour ones, but that gradient largely reflects which channels stream long. Holding the channel constant, the same comparison shrinks to 1.10x to 1.22x. Judge a listing on its typical session, not its longest one.
How long is the average Kick stream?
The median Kick session ran 1.64 hours across 491,392 sessions that began between 2026-09-02 and 2026-09-07 UTC, against 2.23 hours on Twitch over the identical window. Our Kick sampler polls on a 20.1 minute median cycle against Twitch's 15.0, so roughly 2.5 minutes of that 35 minute gap is instrument rather than behaviour.
Why do published Twitch duration figures disagree with each other?
Usually the UTC day boundary. Streams crossing midnight land in two daily tables, and reading only one truncates them. In our data 14.47% of broadcasts born on 2026-09-05 were still live at midnight, and reading a single day put the median at 2.014 hours instead of the stitched 2.265 hours, while halving the measured length of the crossing streams themselves.
Does the first hour matter most?
The opposite, on our measurements. Hour one is the weakest hour of a four hour broadcast at 1.17x the first sighting, against 1.48x in hour four. Live discovery appears to need time to work, which is inference rather than something we measured directly, but the pattern held in every opening-viewer band from single digits to 100 or more concurrent viewers.
Related Articles
Continue learning with these related guides.
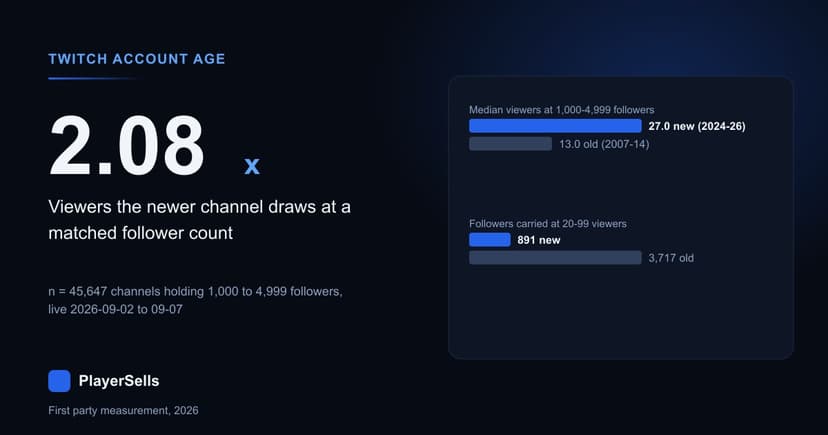
Does Twitch Account Age Still Matter? We Measured 432,192
Across 432,192 Twitch channels read on 2026-09-08, account age is almost pure accumulation, and at a matched follower count the newer channel wins.
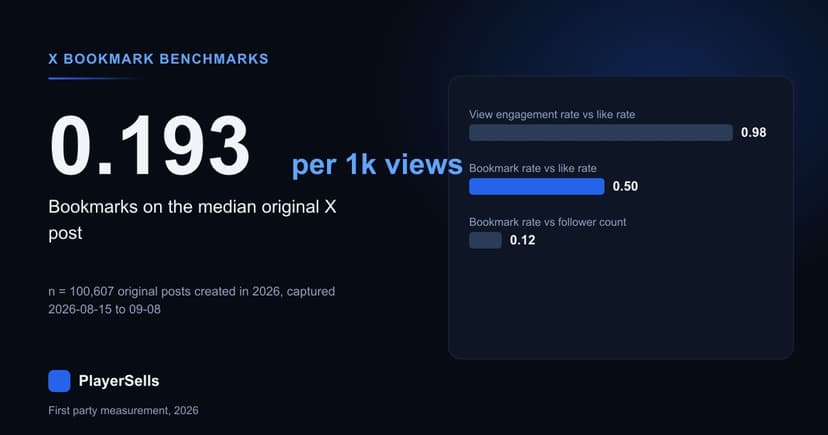
X Bookmark Rate Benchmarks From 94,318 Scored Accounts
Half the X accounts we scored on ten or more posts bookmark under 0.0273% of their views, and a third of original posts get no bookmarks at all.