Where X Posts Come From: 617,398 Posts by Source Label
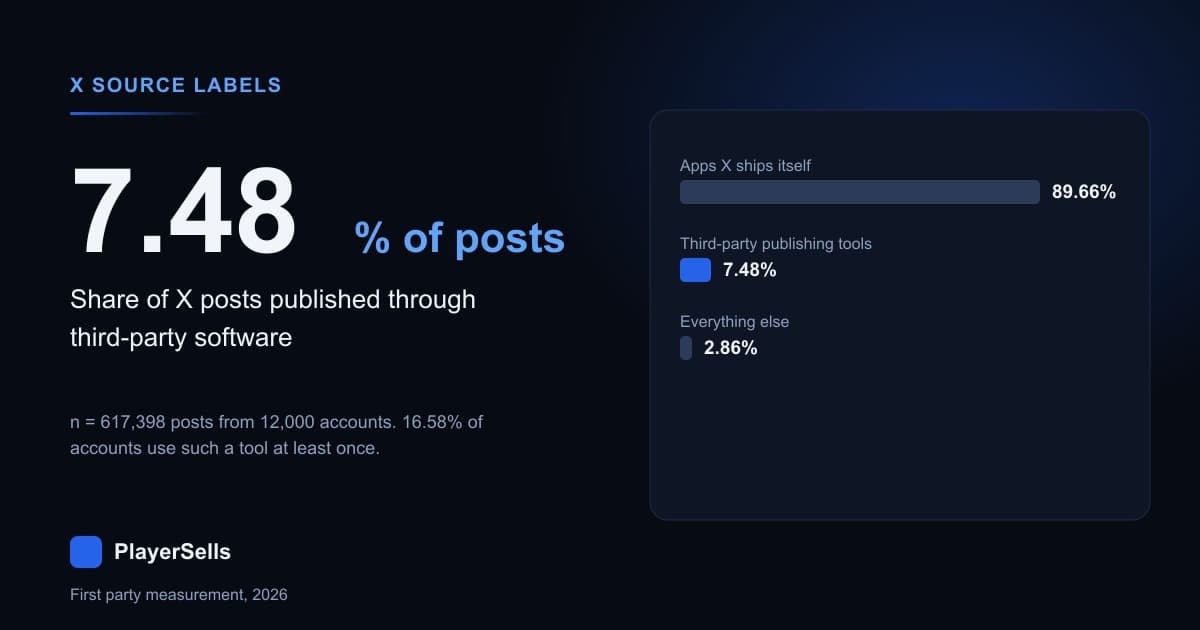
We read the source label on 617,398 X posts from 12,000 accounts: 89.66% came from an app X ships, and 7.48% from third-party publishing software.

Across 617,398 X posts captured from 12,000 randomly drawn accounts between 2026-08-15 and 2026-09-08, we measured that 89.66% carried a source label belonging to an app X ships itself, and 7.48% came from third-party publishing software such as Sprout Social, Buffer or Hootsuite. Count only original posts and the software share rises to 11.83%. The account-level figure is the one nobody publishes: 16.58% of the accounts in that draw posted through a named scheduling tool at least once, which is 2.2 times the share of posts. Both numbers were reproduced on a second, disjoint draw of 8,000 accounts.
Read that as a 2026 picture. In an independent 10 percent block sample of the same store, 94.15% of captured posts were written in 2026 and 96.01% since the start of 2025, with a thin tail reaching back to 2009.
Every X post carries a source label, a short string naming the software that created it. Our X engine stores that string on roughly 100% of what it captures: 617,398 of 617,398 rows in the main draw, and 629,181 of 629,181 in an independent 10 percent block sample. That makes the label the only public fingerprint of how an account is actually operated, and the reason it matters to anyone buying one.
One thing to settle before the numbers. A source label identifies software, not intent. A newsroom running Sprinklr, a football club running Grabyo and a solo writer running Typefully are all "automated" by the label, and none of them is a bot farm. This article does not call any account a bot, and neither should you on the strength of a label.
How much of X is posted by software?
The three big first-party clients carry most of the timeline. In our 12,000-account draw, Twitter for iPhone, Twitter Web App and Twitter for Android together account for 86.98% of all captured posts, and the same three labels account for 87.09% of an independently drawn 10 percent block sample of 629,181 posts. Two sampling methods, one answer.
Below that the picture changes. Named third-party publishing tools take 7.48% of all posts but 11.83% of original posts, because schedulers almost never retweet. Retweets are 33.18% of the output we captured from first-party apps and 1.14% of the output from third-party tools.
This is the raw top of the label distribution, measured across those 617,398 posts. The group column is our classification, and the section after this one gives the rules so you can regroup it yourself.
| Source label | Group | Posts | Accounts | Share of posts |
|---|---|---|---|---|
| Twitter for iPhone | First-party app | 269,002 | 8,691 | 43.57% |
| Twitter Web App | First-party app | 175,742 | 6,958 | 28.46% |
| Twitter for Android | First-party app | 92,258 | 4,660 | 14.94% |
| Sprout Social | Third-party publisher | 7,705 | 353 | 1.25% |
| Twitter Web Client | First-party app | 6,237 | 936 | 1.01% |
| Twitter for iPad | First-party app | 5,887 | 631 | 0.95% |
| Twitter Media Studio | X publishing surface | 5,057 | 480 | 0.82% |
| Hootsuite Inc. | Third-party publisher | 4,366 | 194 | 0.71% |
| Buffer | Third-party publisher | 4,230 | 289 | 0.69% |
| TweetDeck Web App | First-party app | 4,119 | 260 | 0.67% |
| Sprinklr | Third-party publisher | 2,635 | 135 | 0.43% |
| trueanthem_pro2 | Third-party publisher | 2,557 | 103 | 0.41% |
| Metricool | Third-party publisher | 2,537 | 89 | 0.41% |
| Echobox-X | Third-party publisher | 1,859 | 45 | 0.30% |
| Emplifi | Third-party publisher | 1,757 | 76 | 0.28% |
| SocialFlow | Third-party publisher | 1,685 | 142 | 0.27% |
| Userlocal SocialInsight | Third-party publisher | 1,398 | 104 | 0.23% |
| Typefully | Third-party publisher | 1,262 | 115 | 0.20% |
| Sprinklr Publishing | Third-party publisher | 1,012 | 57 | 0.16% |
| dlvr.it | Third-party publisher | 962 | 59 | 0.16% |
What counts as a first-party client and what counts as a tool?
Our grouping rule has three parts and we applied it to 936 distinct labels seen in the block sample. First-party app means one of the client names X ships: the iPhone, Android, iPad and Mac apps, Twitter Web App, Twitter Web Client, and TweetDeck, which X rebranded as X Pro and moved behind its own paid tier. X publishing surface means Twitter Media Studio and the advertising composers, labels X issues under its own brand for scheduling and ad composition rather than a person typing. Third-party publisher means a commercially available product, not built by X, whose job is to publish or schedule on an account holder's behalf.
That middle group is where the industry usually gets it wrong, and it is where our own working brief got it wrong too. TweetDeck and Twitter Media Studio are routinely listed alongside Buffer and Hootsuite as publishing tools. They are X's own software. In our draw the X publishing surfaces carried 1.05% of posts across 615 accounts and TweetDeck Web App carried a further 0.67% across 260 accounts. Move those into the third-party bucket and the software share jumps by about 1.7 points without a single account changing behaviour.
The rest of the tail is not a market. Of the 936 labels in the block sample, 601 appear on exactly one account and carry 3,428 posts between them: newsroom scripts, alert feeds and one-off integrations. A further 23 labels take the form of an erased app identifier, covering 861 posts across 381 accounts, where the developer application behind them is no longer named.
Why is the share of accounts double the share of posts?
Because most tool users are light tool users. Of the 12,000 accounts in the draw, 10,011 never produced a post through a named third-party publisher and 1,138 more sent under a tenth of their output that way. The heavy end is thin but real: 165 accounts sent every captured post through a tool.
| Share of the account's captured posts sent through a third-party tool | Accounts | Share of the 12,000 |
|---|---|---|
| None | 10,011 | 83.43% |
| Under 10% | 1,138 | 9.48% |
| 10% to under 50% | 280 | 2.33% |
| 50% to under 90% | 265 | 2.21% |
| 90% to under 100% | 141 | 1.18% |
| Exactly 100% | 165 | 1.38% |
Read the bottom two rows carefully before you buy anything. Those accounts are not written by a person opening an app. They are fed by a queue that somebody else owns, and a queue does not transfer with a password. Our X follower audit tool and our X account due diligence checklist cover the audience side. The source label covers operations.
One honest limit on the account number. Our engine captured a median of 43 posts per account in this draw, with a first quartile of 20 and a ninth decile of 80. "Ever used a tool" measured over 43 posts is a floor, not a total. Among the 9,049 accounts where we captured at least 20 posts the figure rises to 20.63%, and among the 7,859 with at least 40 posts it rises to 22.26%. The disjoint replication draw gave 20.68% and 22.33% for the same two cuts.
Which accounts actually use a publishing tool?
Tool adoption rises with size, and it rises steeply. In our draw, 8.95% of accounts under 1,000 followers ever posted through a third-party publisher against 35.96% of accounts above a million, a 4.0x difference. The second draw reproduced every row within 0.8 points. Follower bands here come from the follower count recorded at capture, so treat them as current size rather than size at posting time.
| Follower band | Accounts | Ever used a third-party publisher | Ever used any non first-party software |
|---|---|---|---|
| Under 1,000 | 1,195 | 8.95% | 11.63% |
| 1,000 to 10,000 | 2,531 | 9.01% | 12.49% |
| 10,000 to 100,000 | 3,125 | 13.60% | 17.79% |
| 100,000 to 1,000,000 | 3,828 | 19.70% | 25.21% |
| Over 1,000,000 | 1,321 | 35.96% | 43.07% |
Accounts that ever touched a tool had a median 344,420 followers against 88,520 for accounts that never did, measured on the 12,000-account draw. Fully software-run accounts, meaning 90% or more of captured posts from non first-party software, are rarer and flatter across size: 1.00% of accounts under 1,000 followers, 3.39% in the 10,000 to 100,000 band and 4.92% above a million, on band counts of 1,195, 3,124 and 1,322 in the re-pull.
Do scheduled posts get less engagement?
Pooled, yes, and by a lot. The median engagement of an original post from a third-party tool was 23 across 45,116 such posts, against 77 across 319,197 posts from first-party apps. That is the number a careless analysis publishes, and it compares different accounts doing different jobs.
Splitting by follower band does not fix it. Inside the 100,000 to 1,000,000 band the pooled medians were 32 for tool posts and 139 for app posts. Inside the above-a-million band they were 30 and 153.5. The gap survives size banding because it was never about size.
Compare an account against itself and the effect disappears. Among 466 accounts that produced at least five original posts from a first-party app and at least five from a third-party tool in the same capture window, the median per-account ratio of tool engagement to app engagement was 0.93, and the accounts split 208 higher against 245 lower. On the disjoint second draw, 297 paired accounts gave a median ratio of 1.08 with a 154 to 126 split. The estimate straddles 1.00 rather than sitting below it.
| Comparison | What it holds constant | n | Result |
|---|---|---|---|
| Pooled, all accounts | nothing | 45,116 vs 319,197 posts | median 23 vs 77 |
| Pooled inside 100k to 1m band | follower band | 14,842 vs 98,217 posts | median 32 vs 139 |
| Within account, 5+ posts each side | the account | 466 accounts | median ratio 0.93 |
| Within account, 10+ posts each side | the account | 272 accounts | median ratio 0.97 |
| Within account, link-free posts only | the account and the link | 270 accounts | median ratio 1.00 |
| Within account, link posts only | the account and the link | 187 accounts | median ratio 1.00 |
| Within account, second disjoint draw | the account | 297 accounts | median ratio 1.08 |
Broken out by product, the within-account ratios cluster around parity: Sprout Social 1.05 across 68 accounts, Sprinklr 0.95 across 27, Hootsuite 0.90 across 46, Buffer 0.88 across 61, Typefully 0.69 across 28 and Metricool 1.52 across 16. Row counts that small carry wide uncertainty, so read the direction rather than the decimal.
What explains the gap between the two comparisons?
Links, mostly. Posts published through a third-party tool carried a link 57.97% of the time against 24.27% for posts from a first-party app, measured on originals and threads in the 12,000-account draw. Within the same account, a post carrying a link earned a median 0.485 times the engagement of that account's link-free posts, measured across 2,851 accounts with at least five posts of each kind, with 2,131 of those accounts scoring lower on links and 626 higher.
Combine those two facts and the pooled result explains itself. Schedulers are used to push links, and within the same account a link post earns about half the engagement of a link-free one. That is composition. None of it is caused by scheduling.
| Group | Original and thread posts | Carries media | Carries a link | Median characters |
|---|---|---|---|---|
| First-party X apps | 319,197 | 64.75% | 24.27% | 122 |
| Third-party publishing tools | 45,116 | 63.36% | 57.97% | 166 |
| X publishing and ads surfaces | 6,495 | 83.25% | 20.40% | 122 |
| Cross-posts from another platform | 2,359 | 39.13% | 95.42% | 109 |
| Everything else | 8,198 | 35.06% | 48.74% | 113 |
Can you spot a scheduler without reading the label?
Often, yes. A scheduled post fires on a minute somebody chose, and people choose round minutes. If posting times were spread evenly, 1.67% of posts would land on an exact minute. In our draw, posts labelled Twitter for iPhone landed on an exact minute 1.97% of the time across 269,207 posts and Twitter for Android 1.85% across 92,431, which is the human baseline and confirms there is no timestamp truncation in the data. Sprinklr posts hit an exact minute 44.21% of the time.
The surprise sits in the middle of that table. Posts labelled Twitter Web Client, which reads like an official X client, land on an exact minute 44.70% of the time across 6,239 posts from 936 accounts, a higher rate than Hootsuite. That is not one heavy poster dragging an average: among the 157 accounts with at least ten posts under that label, the median account's round-minute rate was 41.18% and 104 of the 157 were above 25%. By the same per-account test, the median Twitter for iPhone account sat at 0.00%.
| Source label | Posts | Landed on an exact minute | Median per-account rate |
|---|---|---|---|
| Sprinklr Publishing | 1,012 | 44.96% | n/a |
| Twitter Web Client | 6,239 | 44.70% | 41.18% (157 accounts) |
| Sprinklr | 2,635 | 44.21% | 49.66% (46 accounts) |
| Hootsuite Inc. | 4,366 | 34.29% | 40.43% (67 accounts) |
| Twitter Media Studio | 5,061 | 20.90% | n/a |
| Typefully | 1,262 | 19.33% | n/a |
| Sprout Social | 7,705 | 18.64% | 8.30% (116 accounts) |
| TweetDeck Web App | 4,119 | 17.97% | n/a |
| Buffer | 4,235 | 15.68% | 8.82% (81 accounts) |
| Twitter Web App | 175,765 | 6.91% | 1.96% (3,560 accounts) |
| SocialFlow | 1,685 | 4.63% | n/a |
| Twitter for iPhone | 269,207 | 1.97% | 0.00% (5,569 accounts) |
| Twitter for Android | 92,431 | 1.85% | 0.00% (2,081 accounts) |
| Echobox-X | 1,859 | 0.97% | n/a |
| Metricool | 2,537 | 0.24% | n/a |
Restricting to posts written in 2026 sharpens the pattern rather than dissolving it: Twitter Web Client rises to 46.09% on 5,535 posts while Hootsuite holds at 24.40%. The label's own history is the tell. Of 6,146 posts carrying it in our block sample, 5,535 were written in 2026, and the few hundred written before 2020 land on an exact minute 0.7% to 5.4% of the time. Whatever posts under that name now is not what posted under it then.
The bottom of that table is the caution. Echobox at 0.97% and Metricool at 0.24% sit at or below the even-spread baseline, so timing alone would clear them as human. A tool that jitters its send times leaves no signature at all. The fingerprint catches the naive schedulers and misses the sophisticated ones, which makes it useful as evidence and useless as proof. Timestamps come from X rather than from our crawler, so this pattern cannot be an artefact of when we sampled.
What a source label cannot tell you
It cannot tell you who wrote the post, or whether the writing was any good. It also cannot be trusted as a string, because app developers pick their own names. Our block sample contained 20 labels imitating an official client name that X does not ship, including one reading Twitter for Advertisers with a trailing full stop and one reading Twitter for iPhone with a doubled space. Volumes are trivial, a few hundred posts, but the lesson is not: match the label exactly or you are reading a costume.
The label also disappears. Twenty-three erased app identifiers turned up across 381 accounts in the block sample, each a string where the application name used to be. You can see that an account once posted through software nobody can name any more. You cannot see what that software did.
How should a buyer use this before paying?
Treat the source mix as a due-diligence signal about operations, not a verdict on quality. Pull the last few hundred posts and count the labels. An account sitting in the top row of our concentration table, everything from a phone, is a person you are buying out. An account in the bottom two rows, 90% or more from a scheduler, comes with a content pipeline attached, and the pipeline is the part that does not transfer. Ask who owns the tool seat and who writes the queue.
Then price it accordingly. A media account running Sprout Social with a team behind it is a good buy if you plan to publish at that cadence and a poor one if you expected to run it from your phone. Our measurements say the software is not costing engagement, so do not discount for the tool. Discount for the labour you are not receiving. For comparison, the public X account directory and the PlayerSells marketplace listings show what accounts at each size look like and what is for sale.
Two practical checks before you send money. Run the last 200 posts through our tweet analyzer to see the format mix, then read the posting record the way our guide to reading an X account's real history sets out. The question bites hardest in our aged X accounts category, because an account with ten years behind it has usually changed software more than once. A profile roast says nothing about automation, but it will tell you whether the bio and pinned post survived the last operator.
What this sample is and is not
It is a sample of accounts our X engine tracks, not a census of X. On 2026-09-08 that capture held 123,650 distinct accounts, and the median account in our 12,000-account draw sits just under 100,000 followers. Read the band table above with that in mind. Our scanner works down a follower ordered queue and has not reached the middle of the range: in a 10% block sample of the post store, 21,569 accounts sit between 78,000 and 100,000 followers against 364 between 10,000 and 78,000, so that row is in practice a 78,000 to 100,000 row. Small personal accounts are under-represented too, and they are exactly the accounts least likely to pay for Sprout Social, so a true census of X would almost certainly show a lower third-party share than 7.48%.
The engagement column reproduced exactly as likes plus retweets plus replies plus quotes on all 617,398 rows, so it is a raw count and not a rate. Both draws were selected at random from the enumerated account list rather than by block sampling, so each account's captured history is complete rather than partial.
Common questions about X post sources
Does using Buffer or Hootsuite hurt your reach on X?
Not measurably in our data. Comparing 466 accounts against themselves, posts sent through a third-party tool earned a median 0.93 times the engagement of the same account's posts from an X app, and a disjoint replication of 297 accounts gave 1.08. Restricting both sides to link-free posts moved the median ratio to exactly 1.00 across 270 accounts. The pooled gap of 23 versus 77 is a composition effect, not a penalty.
What share of X posts are scheduled?
In our 12,000-account draw covering 617,398 posts captured between 2026-08-15 and 2026-09-08, 7.48% came from named third-party publishing tools and a further 1.05% from X's own publishing and advertising surfaces. Among original posts only, the third-party share is 11.83%. That is a lower bound on scheduling, because a scheduled post sent from the X web composer still carries the ordinary web label.
Can you tell if an X account is run by a bot from the source label?
No, and the question is the wrong shape. The label names software, not intent. Sprinklr, Sprout Social and Hootsuite are enterprise marketing tools used by staffed teams. The useful reading is operational: an account with 90% or more of its posts from software, which is 3.28% of the accounts in our draw, is being run by a process rather than a person, and that process is what you need to ask about.
Why do so many posts land on an exact minute?
Because somebody scheduled them. Even spread would put 1.67% of posts on an exact minute. We measured 1.97% for Twitter for iPhone across 269,207 posts and 44.21% for Sprinklr across 2,635. The gap is the scheduling fingerprint. Some tools defeat it: Metricool posts landed on an exact minute 0.24% of the time and Echobox 0.97%, both at or below the even-spread baseline.
Do bigger X accounts use more automation?
They are associated with more of it. In our draw, 35.96% of accounts above a million followers ever posted through a third-party publisher against 8.95% of accounts under a thousand, with 1,321 and 1,195 accounts in those bands. Fully software-run accounts are much flatter, moving only from 1.00% to 4.92% across the same range, so scale brings tools in alongside people rather than instead of them.
Is TweetDeck third-party software?
No. X renamed TweetDeck to X Pro in 2023 and gates it behind its own paid tier, so we count it as a first-party client. It carried 0.67% of posts across 260 accounts in our draw. Twitter Media Studio is another label X issues under its own brand, at 0.82% across 480 accounts. Several published lists of publishing tools put both in the third-party column, which inflates the apparent third-party share by roughly 1.7 points.
Does a bought account keep its posting tools?
The login transfers. The tool seat, the content calendar and the person filling it usually do not. That gap is why we treat a high software share as a question rather than a defect, and it is the same reason our guide to the first 90 days after buying an X account puts cadence planning before anything else. Ask for the queue in writing before completion, not after.
Related Articles
Continue learning with these related guides.
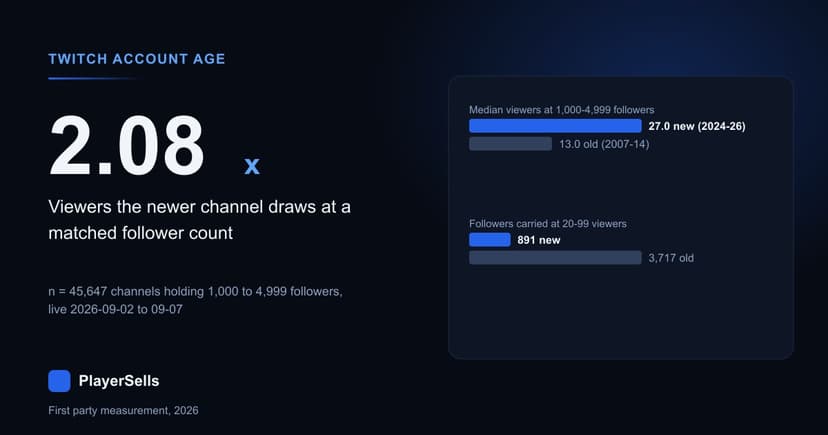
Does Twitch Account Age Still Matter? We Measured 432,192
Across 432,192 Twitch channels read on 2026-09-08, account age is almost pure accumulation, and at a matched follower count the newer channel wins.
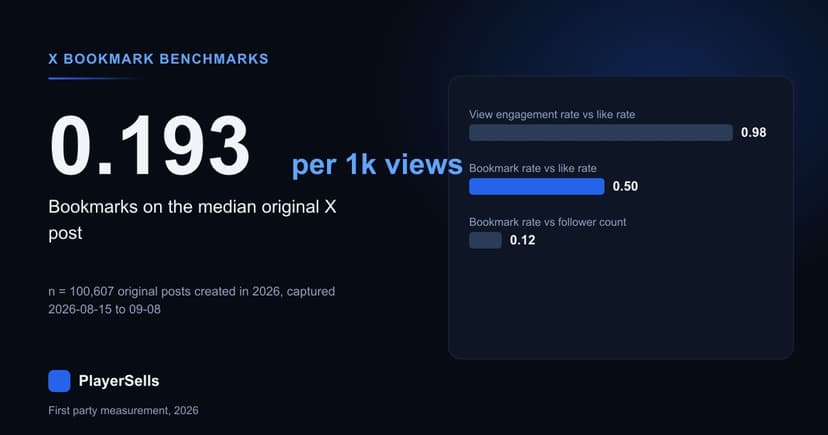
X Bookmark Rate Benchmarks From 94,318 Scored Accounts
Half the X accounts we scored on ten or more posts bookmark under 0.0273% of their views, and a third of original posts get no bookmarks at all.