
What Is a Good Audience Overlap Percentage? 81M Follows
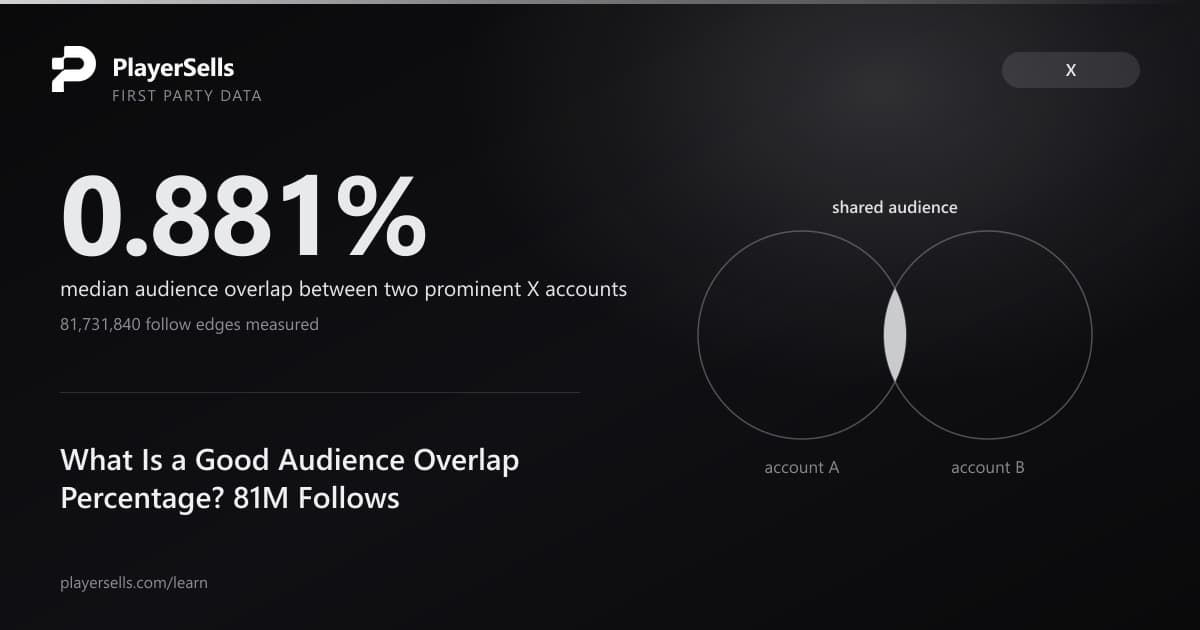
We measured audience overlap percentage across 81,731,840 stored X follow edges: the median pair of prominent accounts shares just 0.881 percent.
The median pair of prominent X accounts shares 0.881 percent of the smaller account's audience. We measured that across 4,560 account pairs built from 190,642 captured follow edges, drawn from an index that held 81,731,840 stored X follow relationships when we took the snapshot on 2026-08-29. Two accounts in the same niche sit at 6.534 percent. Two accounts in different niches sit at 0.715 percent. Not one pair in the 4,560 reached the 60 percent overlap that the single X-specific rule circulating online treats as an ordinary upper case, and exactly one pair passed 50 percent.
Audience overlap on X has no published benchmark. The guides that currently answer the question contradict each other: one widely circulated 2025 explainer tells you to keep average pairwise overlap under 10 to 15 percent, while a January 2026 guide calls 30 to 50 percent the strategic sweet spot for growth collaborations. Several of the headline figures in that genre are attributed to a named market-research benchmark and to a named consumer study, and our own review could not locate either source. Meanwhile the best-resourced influencer-overlap vendors publish no numeric threshold at all, and none of the major ones supports X: their overlap products cover Instagram, TikTok and YouTube.
PlayerSells runs its own crawler on the X graph, so we do not pay per follower lookup, which is the reason nobody else has published this. The article below reports what a normal audience overlap percentage looks like on X, how far it moves with niche and with account size, which of the circulating thresholds survive contact with measured data, and the point below which our own data cannot measure overlap at all. Every figure comes from a query we ran against our engine database on 2026-08-29, and the method sits next to the number so you can judge how much weight it carries.
What is a good audience overlap percentage between two X accounts?
A good audience overlap percentage on X depends almost entirely on whether the two accounts sit in the same niche, and the honest benchmark is far below the advice in circulation. Across 4,560 pairs built from 96 prominent X accounts, we measured a median overlap of 0.881 percent of the smaller account's captured audience. Split by niche, the median for two accounts in the same niche is 6.534 percent and the median for two accounts in different niches is 0.715 percent. The ratio of 9.14 between those two medians is the most useful single number here: niche membership, not follower count, is what makes two audiences the same audience.
Overlap in this article means the overlap coefficient: the number of accounts in our panel that follow both, divided by the smaller of the two captured follower sets. We chose that normalisation because it answers the question a buyer or a promotion partner actually asks, which is what share of the smaller audience already sits inside the larger one. Jaccard similarity, the measure used in the academic literature and formalised as the Shared Audience Metric by Rose and Rohlinger in Socius in June 2024 (DOI 10.1177/23780231241259680), is reported alongside: the median Jaccard across the same 4,560 pairs is 0.370 percent, and the maximum is 27.419 percent.
| Cohort | Accounts | Median captured followers each | Pairs | Median overlap | 90th pct | Max | Pairs at 10% or more |
|---|---|---|---|---|---|---|---|
| Long tail of our index | 250 | 4 | 31,125 | 0.000% | 0.000% | 14.286% | 0.010% |
| Mid band of our index | 250 | 125.5 | 31,125 | 0.000% | 0.000% | 38.356% | 0.087% |
| 96 prominent accounts, different niches | 96 | 1,859.5 | 3,840 | 0.715% | 2.381% | 19.611% | 0.16% |
| 96 prominent accounts, all pairs | 96 | 1,859.5 | 4,560 | 0.881% | 5.165% | 52.102% | 5.55% |
| 96 prominent accounts, same niche | 96 | 1,859.5 | 720 | 6.534% | 24.313% | 52.102% | 34.31% |
| 20 largest accounts in our index | 20 | 8,180 | 190 | 6.044% | 20.590% | 52.590% | 30.00% |
Sample: n = 616 X accounts across four cohorts, 67,000 measured pairs in total, all follow edges captured between 2026-06-09 and 2026-08-29. Overlap is the share of the smaller captured follower set. The two bottom rows of the table are a measurement limit rather than a finding about small accounts, and the section on what this data cannot tell you explains why.
One number in that table deserves separate attention before anything else. Among the 4,560 pairs of prominent accounts we measured, only 32 pairs (0.70 percent) reached 30 percent overlap, only 6 reached 40 percent, and only 1 reached 50 percent. If your working assumption is that two accounts in a similar space routinely share a third of their audience, our measurement says that is roughly a one-in-a-hundred-and-forty event even among accounts chosen for prominence, and it never happened at all between two accounts in different niches.
How did we measure audience overlap, and on what?
Our X follower graph stores one row per observed follow, in the direction source follows target, and the snapshot behind this article held 81,731,840 such rows in 15 GB on 2026-08-29 at 01:20 UTC. We verified the direction rather than assuming it: NASA appears as a source on 119 edges, and NASA's own profile reports that it follows 117 accounts. Two rows of drift on an account whose following list barely moves is what a correct direction and a slightly stale capture look like together. In the other direction, NASA appears as a target on 8,263 edges, meaning 8,263 of the accounts whose following lists we captured follow NASA.
The panel is the set of accounts whose following lists our crawler has expanded. Across the 96 accounts in the main cohort we counted 104,757 distinct source accounts, exactly, in one query. That figure alone is worth stating because the database's own planner statistics estimate the whole table contains 61,591 distinct sources, and 96 accounts cannot be followed by more distinct sources than the table contains. We also walked 75,000 distinct sources in ordered chunks before abandoning the walk on cost, and had covered only part of the identifier space. Any statistic derived from that 61,591 estimate, including a follows-per-source average, is wrong.
Depth matters more than panel size, and this is the part most readers should carry away. We sampled 300 panel accounts and compared how many follows we captured for each against how many that account's profile says it follows. Below 200 follows our capture is essentially complete. Above 200 it plateaus hard, at a median of roughly 203 to 217 captured follows no matter how many the account actually follows.
| Profile follows this many accounts | Panel accounts | Median profile following | Median follows we captured | Max captured | Median capture rate |
|---|---|---|---|---|---|
| Under 100 | 40 | 61 | 58 | 152 | 95.1% |
| 100 to 199 | 39 | 144 | 143 | 194 | 99.3% |
| 200 to 499 | 83 | 324 | 203 | 231 | 62.7% |
| 500 to 999 | 60 | 692.5 | 210 | 311 | 30.3% |
| 1,000 to 4,999 | 60 | 1,643 | 217 | 312 | 13.2% |
| 5,000 or more | 18 | 8,624.5 | 216.5 | 332 | 2.5% |
Sample: n = 300 panel accounts sampled at random from the followers of six cohort accounts, each account's captured out-degree counted exactly against the follow count on its stored profile. Mean captured follows per panel account across the 300 is 181.74. A separate draw of 250 accounts gave a median of 201 captured follows, an interquartile range of 142.75 to 213, and a maximum of 413.
Two consequences follow from that table, and both cut against overstating our own numbers. First, our panel is not a random slice of X: the median panel account has 65,170 followers, 10,109 posts, and 40 percent of the 250 we profiled carry a blue check. Overlap measured through that panel is overlap among mid-sized, active, heavily posting accounts, not among the general population of the platform. Second, because each panel account contributes at most roughly 200 follows, the intersections we count are truncated, and a truncated intersection divided by two truncated denominators is a conservative estimate rather than an inflated one.
On the target side the sampling is far more severe, and we would rather say so plainly than bury it. Across the 96 accounts in the main cohort, the median real follower count is 8,892,262 and the median captured follower set is 1,859.5, a capture rate of 0.0225 percent. For the largest account in our index the numbers are 38,704 captured against 241,476,080 real, or 0.0160 percent. We are not reading a follower list. We are reading a fixed panel of roughly a hundred thousand accounts and asking which of them follow both of two targets, which is a legitimate estimator of the population ratio only to the extent that the panel behaves like the population.
Two columns in this table were checked and then set aside. The edge type column carries exactly one value, follows, in both the X and the Bluesky graph, so it is not a dimension. The weight column carries five values, and we diagnosed it before using it: weight 1 appears from the first day of the window, weight 2 cannot appear until 16 days in, weight 3 not until day 46, and 91.2 percent of sampled sources carry a single weight value across their whole following list. Weight is a re-crawl counter. Grouping accounts by it would publish a picture of our own cron schedule, so no figure in this article uses it.
How much do two accounts in the same niche actually share followers?
Two prominent X accounts in the same niche share a median of 6.534 percent of the smaller one's captured audience, against 0.715 percent for two accounts in different niches. We measured that across 720 same-niche pairs and 3,840 different-niche pairs, built from the same 96 accounts so that the two groups are matched on size: every account in the cohort has between 798 and 3,519 captured followers, with a median of 1,859.5. The same-niche distribution is also much wider. Its 25th percentile is 2.652 percent, its 75th percentile is 14.137 percent, its 90th percentile is 24.313 percent, and its maximum is 52.102 percent.
Niche was assigned by hand, and that choice needs defending. Our accounts table carries an automatic category label, but among the 767 candidate accounts we drew from, only 310 of them (40.4 percent) have one at all, and inspection shows the label is unreliable: a professional wrestler labelled design, a rocket company labelled design, an adult subscription platform labelled news, a crypto exchange labelled sports. Building the article's central comparison on a variable that wrong would have buried the effect rather than measured it. We therefore assigned 96 accounts by hand to six niches, 16 each: crypto, news, sports, music, tech and movies.
| Niche | Accounts | Pairs | Median captured followers | Median overlap | 90th pct | Max | Median shared followers |
|---|---|---|---|---|---|---|---|
| crypto | 16 | 120 | 1,765.5 | 22.67% | 34.29% | 52.10% | 340.5 |
| tech | 16 | 120 | 1,943.5 | 6.36% | 20.86% | 34.86% | 110 |
| sports | 16 | 120 | 1,946 | 5.91% | 19.28% | 31.57% | 111.5 |
| music | 16 | 120 | 1,669 | 4.58% | 11.01% | 33.50% | 73 |
| news | 16 | 120 | 2,166.5 | 4.52% | 15.23% | 40.06% | 92 |
| movies | 16 | 120 | 1,610 | 3.96% | 10.27% | 33.20% | 62 |
Sample: n = 96 X accounts, 16 per niche, 120 same-niche pairs per niche and 720 in total, all follow edges captured 2026-06-09 to 2026-08-29. Niche assigned by hand from each account's public identity. Median captured followers is stated per niche so you can confirm the six groups are size matched and the differences between them are not a size artifact.
Named pairs make the range concrete. At the top, CoinMarketCap and coingecko share 756 of our panel accounts, which is 52.10 percent of coingecko's captured audience of 1,451. Two American broadcast news accounts, ABC and NBCNews, share 687, or 40.06 percent of the smaller set. Spotify and AppleMusic share 618, or 33.50 percent. Marvel and MarvelStudios, two accounts run by the same company, share 543, or 32.81 percent. Bitcoin and ethereum share 606, or 31.93 percent. Andrej Karpathy and Demis Hassabis share 570, or 34.86 percent of the smaller captured set.
Cross-niche pairs of exactly the same size land an order of magnitude lower. Spotify and ABC share 34 panel accounts (1.57 percent). Spotify and Bitcoin share 18 (0.86 percent). Bitcoin and Shakira share 15 (0.74 percent). Each of those four accounts has between 2,024 and 2,812 captured followers, so the collapse from 33 percent to under 2 percent is not a size effect. Two accounts of identical measured reach can share a third of an audience or a fortieth of one, and the thing that decides which is what they publish about.
One honest caveat belongs with this section. Hand assignment introduces our judgement, and a handful of the 96 sit on a boundary: a film-industry trade publication could reasonably be filed under news rather than movies, and a crypto exchange under business rather than crypto. Misfiling works against the finding rather than for it, because putting an account in the wrong group adds cross-niche pairs to the same-niche bucket and same-niche pairs to the cross-niche bucket, which pulls the two medians toward each other. The 9.14x gap we measured is therefore a floor on the true separation, not a ceiling.
Which niches recycle the same audience hardest?
Crypto recycles its audience far harder than any other niche we measured, by a factor of roughly three and a half over the next one. The median pair of crypto accounts in our cohort shares 22.67 percent of the smaller captured audience, against 6.36 percent for tech, 5.91 percent for sports, 4.58 percent for music, 4.52 percent for news and 3.96 percent for movies. Zero of the 120 crypto pairs failed to overlap at all, and the median crypto pair shares 340.5 of our panel accounts against 62 for the median movies pair.
The full matrix shows where the boundaries actually sit, and some of them are not where a media planner would draw them. Crypto and tech are the only pair of distinct niches with a median above 2 percent, at 2.05 percent, which is roughly three times the cross-niche baseline. Music and movies sit at 1.93 percent, and news pairs with everything at between 0.51 and 1.11 percent. Crypto against music, at 0.28 percent, is the most separated combination in the grid.
| Median overlap | crypto | news | sports | music | tech | movies |
|---|---|---|---|---|---|---|
| crypto | 22.67% | 0.51% | 0.59% | 0.28% | 2.05% | 0.36% |
| news | 0.51% | 4.52% | 1.11% | 0.60% | 1.05% | 1.09% |
| sports | 0.59% | 1.11% | 5.91% | 0.75% | 0.55% | 0.88% |
| music | 0.28% | 0.60% | 0.75% | 4.58% | 0.36% | 1.93% |
| tech | 2.05% | 1.05% | 0.55% | 0.36% | 6.36% | 0.61% |
| movies | 0.36% | 1.09% | 0.88% | 1.93% | 0.61% | 3.96% |
Sample: n = 96 X accounts, 4,560 pairs. Each diagonal cell is 120 same-niche pairs and each off-diagonal cell is 256 cross-niche pairs. Follow edges captured 2026-06-09 to 2026-08-29, overlap normalised on the smaller captured follower set.
Two competing explanations for the crypto result deserve naming, because we cannot separate them with this data. The first is a real property of the audience: crypto accounts on X share a following that treats exchanges, chains, data sites and commentators as one interchangeable feed, so following one really does predict following the next. The second is a property of our crawler: if the crawler expanded a cluster of crypto-adjacent accounts, the panel would be enriched with exactly the users who follow many crypto accounts, and the measured overlap would rise without the platform doing anything. Our panel does skew active and mid-sized, which is the kind of account that follows many exchanges.
What we can say is that the crypto effect survives a size adjustment that the raw percentages do not. Comparing observed shared followers against what independent following would predict for accounts of that size, crypto pairs sit at 30.39 times the baseline, tech at 10.26, sports at 10.02, news at 9.05, movies at 8.55 and music at 8.15. Every same-niche group lands between 8 and 11 except crypto, which is three times higher than any of them. A crawler bias would have to be very specifically shaped to produce that pattern and nothing else.
For anyone buying promotion across several accounts in one vertical, the practical reading is that crypto is the vertical where a multi-account campaign most needs an overlap check before it is booked. Three crypto placements at 22 percent pairwise overlap reach considerably less unique audience than three placements in music at 4.6 percent, even when the follower counts on the invoice are identical. You can run that check for any specific pair with our X audience overlap checker, which computes the same intersection this article measures, against the same graph.
Do two large accounts overlap more than two small ones?
Raw overlap rises sharply with account size, and almost all of that rise is arithmetic rather than audience behaviour. Among the 20 largest accounts in our index, with a median captured follower set of 8,180, we measured a median pairwise overlap of 6.044 percent and found that 30 percent of the 190 pairs cleared 10 percent overlap. Among the 96 mid-size prominent accounts, with a median captured set of 1,859.5, the median is 0.881 percent and only 5.55 percent of pairs clear 10 percent. Seven times more overlap looks like a strong size effect until you work out what independence alone would predict.
The arithmetic is simple enough to check by hand. If two accounts drew their followers independently from a common panel, the expected intersection would be the product of the two captured sets divided by the panel size, and the resulting overlap coefficient would equal the larger account's share of the panel. Double both accounts' size and the expected overlap coefficient doubles too, with no change whatsoever in how related the two audiences are. Any bare overlap percentage compared across accounts of different sizes is therefore comparing two different things.
Correcting for that turns the finding inside out. We calibrated an independence baseline against the different-niche pairs, then measured each cohort as a multiple of what that baseline predicts for its own sizes. The 20 largest accounts land at 2.03 times chance. Same-niche pairs at a quarter of their size land at 12.28 times chance. Being one of the twenty most-followed accounts on the platform buys about a doubling of shared audience; being in the same niche buys about a twelvefold increase.
| Cohort | Pairs | Median captured followers | Median raw overlap | Shared followers observed | Expected if independent | Connection index |
|---|---|---|---|---|---|---|
| Long tail of our index | 31,125 | 4 | 0.000% | 11 | 20 | 0.56 |
| Mid band of our index | 31,125 | 125.5 | 0.000% | 2,587 | 2,268 | 1.14 |
| Prominent, different niche | 3,840 | 1,859.5 | 0.715% | 70,181 | 49,961 | 1.40 |
| 20 largest accounts | 190 | 8,180 | 6.044% | 135,680 | 66,991 | 2.03 |
| Prominent, same niche | 720 | 1,859.5 | 6.534% | 115,912 | 9,439 | 12.28 |
Sample: n = 616 X accounts, 67,000 pairs, follow edges captured 2026-06-09 to 2026-08-29. The connection index is total observed shared followers divided by total expected under independent following, with the panel calibrated at 302,481 accounts from the different-niche pairs. That calibration is a modelling choice and it makes the different-niche row sit near 1 by construction; the other four rows are then measured against it.
The middle rows of that table carry a warning about our own method rather than about X. Mid-band accounts, with a median of 125.5 captured followers each, show a median raw overlap of exactly zero and a connection index of 1.14. Zero overlap at that depth does not mean the audiences are unrelated. It means the expected intersection under independence is small enough that observing zero is the normal outcome, and our measurement has almost no power to detect a real difference. The same holds, far more strongly, for the long-tail row.
The practical version for anyone valuing an account: a high overlap percentage against a much larger account is weak evidence of anything, because a large account occupies a large share of any panel. A high overlap against an account of similar size is much stronger evidence that the two audiences are genuinely the same people. If you are comparing accounts by size before you compare them by audience, the X follower percentile rank tool puts a single account's follower count in the context of the 18,913,737 X accounts our index held on 2026-08-29, and our follower count benchmarks cover that distribution in detail.
Why is an overlap percentage meaningless without both account sizes?
Audience overlap is asymmetric, and a single percentage hides which direction it points. We measured 3,090 panel accounts that follow both the largest account in our index and SpaceX. Expressed against SpaceX's captured audience of 6,255, that is 49.40 percent. Expressed against the larger account's captured audience of 38,704, the same 3,090 accounts are 7.98 percent. Both numbers are correct, they describe the identical set of people, and a vendor threshold that says "keep overlap under 15 percent" gives opposite verdicts depending on which one you were handed.
The full row for that account shows how wide the gap runs. All ten of its strongest overlaps clear 20 percent when measured against the smaller account, and nine of those ten fall below 9 percent when measured against its own. Only realDonaldTrump, itself large enough at 18,161 captured followers, keeps a double-digit figure in both directions.
| Paired with | Its captured followers | Shared with the largest account | Share of the paired account | Share of the largest account |
|---|---|---|---|---|
| SpaceX | 6,255 | 3,090 | 49.40% | 7.98% |
| realDonaldTrump | 18,161 | 7,030 | 38.71% | 18.16% |
| MrBeast | 8,097 | 2,491 | 30.76% | 6.44% |
| NASA | 8,263 | 2,488 | 30.11% | 6.43% |
| X | 11,506 | 3,127 | 27.18% | 8.08% |
| JoeBiden | 8,595 | 2,246 | 26.13% | 5.80% |
| CNN | 6,228 | 1,430 | 22.96% | 3.69% |
| BarackObama | 10,002 | 2,149 | 21.49% | 5.55% |
| nytimes | 7,581 | 1,561 | 20.59% | 4.03% |
| grok | 12,929 | 2,586 | 20.00% | 6.68% |
Sample: n = 20 accounts, 190 pairs, drawn as the 20 highest in-degree targets in a 2 percent page sample of our 81,731,840 stored follow edges, then counted exactly. The largest account in this set has 38,704 captured followers out of 241,476,080 real ones, a capture rate of 0.0160 percent.
Three rules follow, and they are the whole of what a practitioner needs from this article. Always state the denominator: "40 percent of B's audience also follows A" and "40 percent of A's audience also follows B" are different claims and only one of them is usually true. Always state both sizes: an overlap coefficient between a 5,000-follower account and a 5,000,000-follower account is close to a statement about the big account's reach, not about the two audiences being alike. And compare like with like: our same-niche and different-niche medians are only comparable because we forced every account in that cohort into an 800 to 3,500 captured-follower band first.
The academic convention avoids the asymmetry problem by using Jaccard similarity, which divides the intersection by the union and therefore returns one number per pair rather than two. Jaccard is the safer statistic and the harder one to sell, because it is always small: our median Jaccard across the 4,560 prominent pairs is 0.370 percent and even the CoinMarketCap and coingecko pair, at 52.10 percent by overlap coefficient, is 25.71 percent by Jaccard. If a tool hands you an overlap figure without telling you which of the three normalisations it used, the figure is not comparable to anything.
What share of a big X account's followers also follow another big account?
About two thirds of a prominent X account's captured audience also follows at least one of 95 other prominent accounts. We measured that directly: across the 96 accounts in the main cohort, the median account has 68.45 percent of its captured followers shared with at least one other account in the set, and the mean is 67.09 percent. Looked at from the follower side rather than the account side, of the 104,757 panel accounts that follow at least one of the 96, exactly 59.862 percent follow only one of them and 40.138 percent follow two or more. Only 3.073 percent follow six or more.
The account-side view and the follower-side view of the same data are not in conflict, and the gap between them is instructive. Most panel accounts follow just one of the 96, but the ones who follow several are counted once inside every account they follow, so from any given account's vantage point the majority of its audience appears shared. An account owner who checks overlap against a large slate of comparable accounts will nearly always find a scary-looking share of the audience already spoken for, and that is arithmetic, not a problem with the account.
The spread across the 96 accounts is enormous, and it is the most commercially useful thing in this section. At the top, coingecko has 92.28 percent of its captured audience shared with at least one other cohort account, followed by Gate at 89.65 percent, CoinMarketCap at 89.63 percent and kucoincom at 88.89 percent. At the bottom, the Korean-language music account nosongang has 1.08 percent, BIGHIT_MUSIC has 16.79 percent, the Indian news agency ANI has 30.68 percent and NetflixBrasil has 37.75 percent.
Language and region separate audiences more cleanly than niche does. The five lowest sharing rates in our cohort all belong to accounts aimed primarily at Korean, Indian or Brazilian audiences, while their same-niche peers publish mainly in English. We cannot prove language causes the separation from this data alone, since language, country and topic all travel together on those accounts, and our panel itself skews English. What we can say is that within a niche, an account whose audience reads a different language is the account whose followers our panel almost never shares with anyone else.
For a buyer, the practical use of this number is not the headline but the outlier check. If you are considering an account and its measured share of audience held in common with obvious peers is 90 percent, you are buying reach that a competitor already has. If it is 20 percent, you are buying something closer to an exclusive audience, and that is worth paying for whether or not the follower count is smaller. Our audience finder and the X accounts directory both work off the same index, so you can build the peer list before you run the comparison.
Does audience overlap mean an influencer campaign is wasting money?
Audience overlap wastes budget only above thresholds that almost never occur, and the thresholds published as normal are far above what we measured. Of 4,560 pairs of prominent X accounts, 94.45 percent sit below 10 percent overlap and 96.32 percent sit below 15 percent. The 30 to 50 percent band that one January 2026 guide calls the sweet spot for growth collaborations contains 31 of our 4,560 pairs, or 0.68 percent, all of them same-niche. Zero pairs reached 60 percent, the figure the one X-specific rule in circulation uses to describe an audience that mostly already sees your content.
| Overlap threshold | All 4,560 pairs | Same niche (720 pairs) | Different niche (3,840 pairs) |
|---|---|---|---|
| 10% or more | 253 (5.55%) | 247 (34.31%) | 6 (0.16%) |
| 15% or more | 168 (3.68%) | 165 (22.92%) | 3 (0.08%) |
| 30% or more | 32 (0.70%) | 32 (4.44%) | 0 (0.00%) |
| 40% or more | 6 (0.13%) | 6 (0.83%) | 0 (0.00%) |
| 50% or more | 1 (0.02%) | 1 (0.14%) | 0 (0.00%) |
| 60% or more | 0 (0.00%) | 0 (0.00%) | 0 (0.00%) |
Sample: n = 96 X accounts, 4,560 pairs, follow edges captured 2026-06-09 to 2026-08-29, overlap normalised on the smaller captured follower set. Same-niche and different-niche groups are size matched, every account holding between 798 and 3,519 captured followers.
Read against that table, the advice in circulation is not so much wrong as aimed at a different platform. Guidance to keep average pairwise overlap under 10 to 15 percent is satisfied automatically by 94 percent of the pairs we measured; following it on X would mean rejecting almost nothing. Guidance that treats 30 to 50 percent as a target band describes a state that 0.68 percent of our pairs reach. Both pieces of advice were written for Instagram and TikTok overlap products, and on those platforms a follow is a cheaper, more casual act than it is on X, where the median panel account we profiled follows just 300 accounts in total.
The one genuinely useful threshold our data supports is niche-relative rather than absolute. Inside a niche, 34.31 percent of pairs clear 10 percent overlap and the median is 6.534 percent, so a same-niche pair at 3 percent is unusually independent and a same-niche pair at 25 percent is in the top decile. Across niches, 0.16 percent of pairs clear 10 percent, so a cross-niche pair at 10 percent is a genuine signal that the two accounts are more connected than their subject matter suggests. Judge a pair against its own niche's distribution, not against a universal number.
The financial version is simple. Two placements at 6.5 percent overlap, the same-niche median, deliver about 93.5 percent of the smaller account's audience as incremental reach, which for most budgets is not a reason to change plan. Two placements at 30 percent, which happens in 4.44 percent of same-niche pairs, means nearly a third of the smaller audience is being paid for twice. The check is cheap and takes one query, so run it before booking rather than modelling it. Pricing the placement is a separate exercise from measuring it.
Why do audience overlap tools not support X (Twitter)?
Audience overlap tools skip X because the follower data costs more than the product earns. Comparing two accounts properly means reading both follower lists, and X's paid API charges per lookup rather than per account, so a single comparison between two accounts with hundreds of thousands of followers each is a large bill before anyone has seen a result. The current tiers, their limits and their per-call pricing are documented in X's own API documentation. Every major influencer-overlap product we checked lists Instagram, TikTok and YouTube, and none of them lists X.
The consequence for anyone searching is that the results for X-specific overlap queries are mostly Instagram advice with the platform name swapped, plus a scattering of academic PDFs about follower fraud that were never written to answer the question. Nobody on the first page can state what follower overlap actually is on X, because measuring it requires either a very large API budget or a crawler you already run for another reason.
PlayerSells is in the second category. Our crawler indexes X accounts to power the marketplace and the free tools, and the follower graph is a by-product of expanding accounts we were going to fetch anyway. Storing it costs 15 GB. That is the entire reason this article can exist and a vendor blog's cannot, and it is also the reason our numbers carry a limitation a paid API pull would not have: we captured whatever our crawl priorities pointed at, not a designed sample.
Two things follow for how you should read any overlap number you are given, ours included. Ask what the denominator is, because a percentage without a stated follower set is not checkable. Ask whether the numbers came from complete follower lists or from a panel, because a panel is not wrong but it is a different measurement, and only a panel can be run at this scale without a five-figure invoice.
Is audience overlap higher on Bluesky than on X?
We ran the identical measurement on 41,063,026 stored Bluesky follow edges and we are not publishing a platform comparison from it, because the two measurements are not comparable enough to support one. On a size-matched Bluesky cohort of 96 accounts with a median of 2,178 captured followers each, the median pairwise overlap is 0.872 percent, against 0.881 percent for all pairs of our X cohort and 0.715 percent for the different-niche X pairs. Depending on which X figure you pick as the comparator, Bluesky comes out either indistinguishable or 22 percent higher, and a finding that flips on the choice of comparator is not a finding.
| Statistic | X, different niche | X, all pairs | Bluesky, uncurated cohort |
|---|---|---|---|
| Pairs measured | 3,840 | 4,560 | 4,560 |
| Median captured followers | 1,859.5 | 1,859.5 | 2,178 |
| Median overlap | 0.715% | 0.881% | 0.872% |
| 90th percentile | 2.381% | 5.165% | 3.516% |
| 99th percentile | 5.120% | 27.099% | 8.006% |
| Maximum | 19.611% | 52.102% | 22.434% |
| Pairs at 10% or more | 0.16% | 5.55% | 0.48% |
| Pairs with zero overlap | 4.11% | 3.71% | 3.64% |
Sample: n = 96 X accounts and 96 Bluesky accounts, 4,560 pairs each, X edges captured 2026-06-09 to 2026-08-29 and Bluesky edges 2026-06-10 to 2026-08-28. The Bluesky cohort was selected purely by in-degree band with no niche curation, which is exactly why it is not a like-for-like comparison with the hand-built X cohort.
Three problems block the comparison, and naming them is more useful than the number. The X cohort was deliberately constructed with six niches inside it and the Bluesky cohort was not curated at all, so their pair mixes differ by design. The overlap coefficient is a function of panel size, and the X panel and the Bluesky panel were built by two different crawlers with different seed sets and different depth caps. And the Bluesky cohort skews heavily toward United States political accounts, which is a topical cluster of its own that we did not control for.
The Bluesky run is still worth reporting as a method check. Getting a median within 20 percent of the X figure from a completely separate graph, a different crawler and a different account population suggests the measurement is picking up something structural about follow graphs rather than an artifact of one pipeline. If you want the Bluesky side of our index on its own terms, the Bluesky accounts directory and our Bluesky account benchmarks cover it.
What this data cannot tell you
Our panel is not a random sample of X, and that is the largest single caveat on every number above. The accounts whose following lists we captured are accounts our crawler chose to expand, and the 250 we profiled have a median of 65,170 followers, a median of 10,109 posts, and a blue check on 40 percent of them. Overlap measured through that panel is overlap among active mid-sized accounts. A finding that two accounts share 20 percent of an audience means 20 percent of the panel members who follow the smaller one also follow the larger one, and the panel skews toward people who follow a lot of prominent accounts in the first place.
The capture rate on the target side is the second caveat, and it is severe. Across the main cohort the median account has 8,892,262 real followers and 1,860 captured ones, a rate of 0.0225 percent, with a range from 0.0037 percent to 0.3288 percent. We are not reading follower lists and we never claim to. Because the panel is common to every account we measure, the ratio between two accounts is a defensible estimator of the population ratio, but only under the assumption that the panel behaves like the population, and we have just given you three reasons it does not.
Below roughly a thousand captured followers, our data cannot measure overlap at all. We tested this deliberately: a cohort of 250 accounts drawn from the body of our index has a median of 4 captured followers each, and 99.965 percent of its 31,125 pairs share zero panel accounts. That is exactly what independent following predicts at that depth, 11 observed shared followers against 20 expected, so the zeros carry no information. A second cohort at a median of 125.5 captured followers still shows a median overlap of zero and 96.562 percent zero-overlap pairs. Any tool that hands you a confident overlap percentage for two small accounts is either using data we do not have or reporting noise.
Depth truncation affects the numerator and both denominators at once. Our crawler captures a panel account's complete following list only up to about 200 follows, and above that the captured list plateaus near 217 no matter how many the account really follows. We cannot tell from the stored rows which subset of a large account's follows was kept, so we cannot correct for it. The direction of the resulting bias is not something we can sign with confidence, which is why the article leans on rank ordering and on ratios between cohorts rather than on any claim that an absolute figure transfers to the whole platform.
Three further limits belong on the record. Our niche labels are hand-assigned and therefore carry our judgement, though misassignment pulls the same-niche and different-niche medians together rather than apart. The independence baseline behind the connection index uses a panel size estimated from the different-niche pairs themselves, with an interquartile range from 166,786 to 584,222, so treat the index as a comparison between cohorts rather than as an absolute multiple. And the last-seen timestamp on each edge records when our crawler last saw the follow, not when the follow happened, so nothing in this article is a claim about how audience overlap changes over time.
What the data does support is narrower and, we think, more useful than a universal threshold. Two accounts of comparable measured reach, in the same niche, in the same language, share far more audience than two accounts that differ on any of those three, and the size of that gap is roughly nine to one at the median and twelve to one after adjusting for size. Anyone quoting a single acceptable audience overlap percentage without stating the niche, the language and both follower counts is quoting a number that our measurement says cannot exist.
How do you check the overlap between two specific X accounts?
Checking a specific pair takes one query against the same graph this article measured. Our X audience overlap checker takes two handles and returns the accounts in our panel that follow both, using the identical intersection and the identical index of 81,731,840 stored follow edges. The tool reports the raw shared count as well as the percentage, which matters because the shared count is what tells you whether the percentage rests on 700 accounts or on 7.
Read the result against the benchmarks in this article rather than against a vendor threshold. A same-niche pair below 2.652 percent sits in the bottom quartile of same-niche pairs we measured and is unusually independent. A same-niche pair above 14.137 percent sits in the top quartile. A different-niche pair above 2.381 percent is already in the top decile of the 3,840 different-niche pairs we measured, and a different-niche pair above 10 percent is in the 0.16 percent of cases where two accounts are far more connected than their subject matter suggests.
For a full picture of an account before you buy or book it, overlap is one input among several. Run a follower authenticity audit on both handles first, because overlap between two audiences that are partly automated tells you about the automation rather than about the audience. If you are weighing an account for cold outreach specifically, our guide to buying an X account for outreach covers audience relevance, and the follower tier guide covers what size actually buys you. If the pair checks out and you want to transact, our escrow process is the safe path.
Questions and answers
What is a normal audience overlap percentage on X?
The median pair of prominent X accounts overlaps at 0.881 percent of the smaller account's captured audience, measured across 4,560 pairs. Two accounts in the same niche run at a median of 6.534 percent, and two accounts in different niches at 0.715 percent. Anything above 24.313 percent puts a same-niche pair in the top decile of the 720 same-niche pairs we measured.
Is 20 percent audience overlap too high?
Twenty percent overlap is high for two accounts in different niches and unremarkable for two in the same one. Among 3,840 different-niche pairs we measured, only 3 pairs (0.08 percent) reached 15 percent. Among 720 same-niche pairs, 22.92 percent reached 15 percent and the crypto median alone is 22.67 percent. Judge the figure against its own niche, and always check which account's audience the percentage was divided by.
How do I find out who follows both of two X accounts?
Use our X audience overlap checker, which intersects the two accounts against the same panel of source accounts used in this article. X's own API can do it for a fee by pulling both follower lists, which is why almost no free tool offers it. Our index holds 81,731,840 stored follow edges, so the intersection is a database query rather than an API purchase.
Does high audience overlap mean I am wasting my promotion budget?
Only above thresholds that are rare in practice. Two placements at the same-niche median of 6.534 percent still deliver roughly 93.5 percent of the smaller audience as incremental reach. Of the 4,560 pairs we measured, 0.70 percent reached 30 percent overlap, where paying twice for a meaningful share of an audience starts to be real. Check the specific pair rather than applying a rule.
Which X niche has the highest audience overlap?
Crypto, by a wide margin. The median pair of crypto accounts in our cohort shares 22.67 percent of the smaller captured audience, against 6.36 percent for tech, 5.91 percent for sports, 4.58 percent for music, 4.52 percent for news and 3.96 percent for movies. Crypto also sits at 30.39 times the independence baseline while every other niche sits between 8.15 and 10.26.
Do bigger X accounts share more of their audience?
Bigger accounts show higher raw overlap, mostly for arithmetic reasons. The 20 largest accounts in our index show a median pairwise overlap of 6.044 percent against 0.881 percent for accounts a quarter their size, but once the independence baseline is applied the large accounts sit at only 2.03 times chance while same-niche pairs sit at 12.28 times. Size inflates the percentage; niche creates the actual shared audience.
Can I measure audience overlap for two small X accounts?
Not reliably, and not with our data. In a cohort of 250 accounts from the body of our index, with a median of 4 captured followers each, 99.965 percent of the 31,125 pairs shared zero panel accounts, which is what independence alone predicts. A second cohort at a median of 125.5 captured followers each still returned a median overlap of zero. Below roughly a thousand captured followers, an overlap percentage is noise.
Is audience overlap the same as Jaccard similarity?
No. Jaccard divides the shared followers by the union of both audiences and returns one symmetric number, while the overlap coefficient used here divides by the smaller audience and answers a directional question. The same CoinMarketCap and coingecko pair reads 52.10 percent as an overlap coefficient and 25.71 percent as Jaccard. Our median across 4,560 pairs is 0.881 percent by overlap coefficient and 0.370 percent by Jaccard.
Where does this data come from?
Our own X crawler. We store one row per observed follow in the direction source follows target, and the snapshot behind this article held 81,731,840 rows on 2026-08-29, spanning captures from 2026-06-09 onward. Every figure came from a query against that index, computed over 616 accounts and 67,000 pairs, with no third-party data and no API purchase involved.
The next step, if you came here with two specific handles in mind, is to stop reasoning from thresholds and measure the pair. Run both through the X audience overlap checker, note the shared count as well as the percentage, and compare that percentage against the same-niche or different-niche distribution in this article rather than against a number from a guide written for Instagram. If either handle is one you are considering buying, run it through the follower audit in the same sitting, and browse our published insight reports for the rest of what we measure on the same index.
Free tools for this topic

Published by the PlayerSells editorial team. Data comes from PlayerSells marketplace records and our own crawlers. About PlayerSells · Editorial policy
Related Articles
Continue learning with these related guides.
Verified Kick Channels Simulcast 2.5x as Often as Others
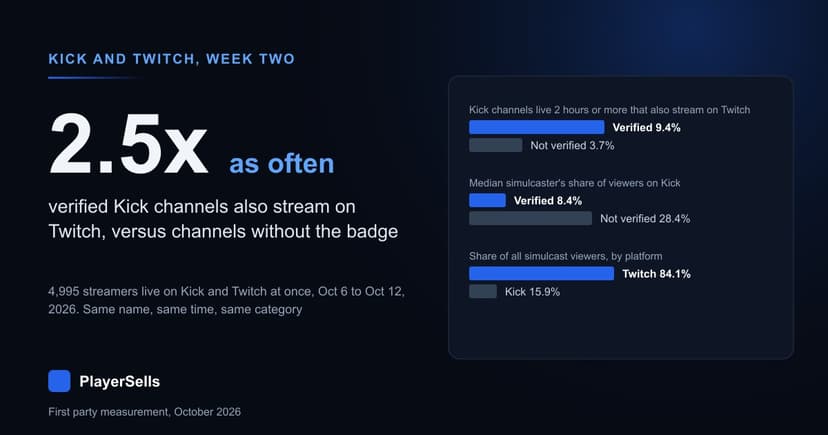
4,995 streamers were live on Kick and Twitch at once, Oct 6 to 12, 2026. 9.4% of verified Kick channels simulcast, against 3.7% of others.
Does X Still Penalize Links? 6.4 Million Posts Measured
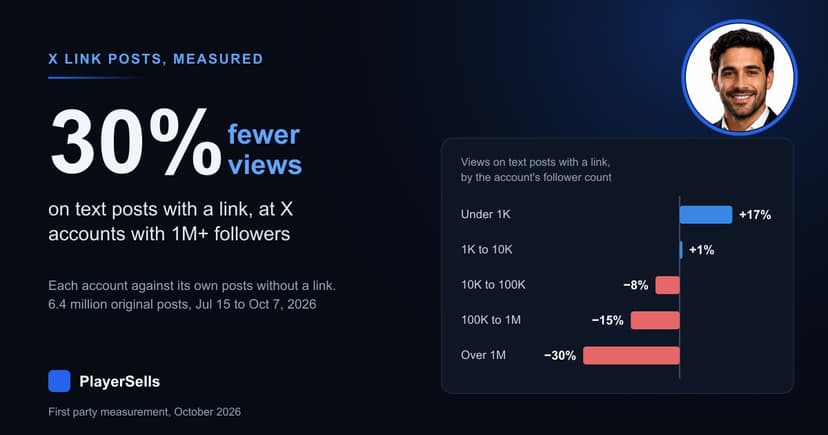
Across 6.4 million X posts, text posts with a link drew 10% fewer views than the same account's posts without one, and 30% fewer at 1M+ followers.
Kick and Twitch Simulcasts: 83% of Viewers Watch on Twitch
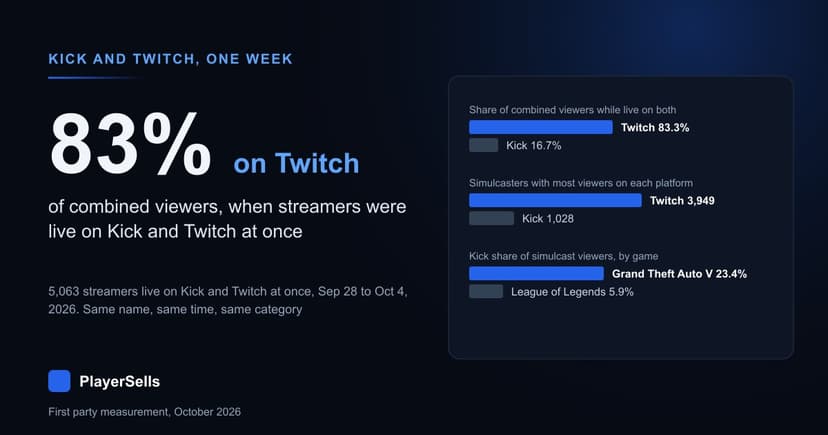
5,063 streamers went live on Kick and Twitch at once from Sep 28 to Oct 4, 2026. Twitch drew 83% of their combined viewers and Kick 17%.