

X Follower Count Benchmarks: What 17.6 Million Accounts Reveal About Where You Rank
Real X follower percentiles from 17.6 million indexed accounts: 61% sit under 1K, only 8% clear 10K and 0.9% pass 100K. Plus ratios, age and price.
If you have 1,000 followers on X, you sit ahead of roughly 61 percent of the accounts in our index. At 10,000 you are in the top 8 percent. At 100,000 you are in the top 0.9 percent, and at a million followers you are one account in about 1,500. Those are the X follower count benchmarks this article is built on, and they come from 17,639,527 indexed X accounts rather than from a curve fitted to a handful of public data points.
Most of what circulates about the Twitter follower distribution is old, second hand, or reported as an average. Averages are the wrong tool for a distribution this skewed. In our 2009 signup cohort the average account carries 15,604 followers and the median carries 939. The average is 16.6 times the median because a thin tail of very large accounts drags it upward. Every figure in this piece is a median or a percentile unless it says otherwise, and every table names the sample it came from. The short version: the median X account in our index has fewer than 1,000 followers, was created in 2017, has posted a few thousand times, and over the last 52 days was more likely to have shrunk than grown.
Where you rank: X follower count benchmarks across 17.6 million accounts
The table below is the core benchmark. It comes from a 2 percent random system sample of the X index, which returned 357,554 accounts. The last column is the one to read first: it tells you what share of accounts sit at or above each threshold, which is the same thing as your percentile from the top.
| Follower tier | Accounts in sample | Share of sample | Accounts at or above | Share at or above |
|---|---|---|---|---|
| Under 1K | 218,428 | 61.1% | 357,554 | 100% |
| 1K to 5K | 90,109 | 25.2% | 139,126 | 38.9% |
| 5K to 10K | 20,220 | 5.7% | 49,017 | 13.7% |
| 10K to 50K | 22,101 | 6.2% | 28,797 | 8.05% |
| 50K to 100K | 3,487 | 0.98% | 6,696 | 1.87% |
| 100K to 500K | 2,689 | 0.75% | 3,209 | 0.90% |
| 500K to 1M | 286 | 0.08% | 520 | 0.15% |
| 1M and above | 234 | 0.07% | 234 | 0.07% |
Three fifths of the index sits under 1,000 followers. That single fact reframes almost every conversation people have about follower counts. The account you think of as small is the modal account on the platform.
What is more useful is the attrition between thresholds. Of the accounts that clear 1,000 followers, 79.3 percent never reach 10,000. Of those that clear 10,000, 88.9 percent never reach 100,000. Of those that clear 100,000, 92.7 percent never reach a million. Each order of magnitude removes between four fifths and nine tenths of the survivors. Growth on X is not a gentle slope, it is a series of cliffs, and the cliff gets steeper the higher you are standing.
Scaling the sample rates back to the full index gives rough population figures: about 6.86 million indexed accounts above 1,000 followers, about 1.42 million above 10,000, about 158,000 above 100,000, and about 11,500 above a million. Treat those as estimates from a sample, not counts. They describe our crawl panel, not the platform, and the next section explains exactly how the two differ.
Is 1,000 followers good on X, and what percentage of accounts have 10K
At 1,000 followers you are in the top 38.9 percent. That is a real threshold but not a rare one: roughly two in five indexed accounts have cleared it. What changes at 1,000 is not your rank, it is the shape of your account. Below 1,000 followers the median account follows more people than follow it, with a follower to following ratio of 0.63. In the 1K to 5K tier the median ratio is 2.19. Crossing 1,000 is the point where an account stops being a consumer of the timeline and starts being a small publisher on it.
The other thresholds people ask about, answered directly from the same sample:
- 5,000 followers puts you in the top 13.7 percent, about 1 account in 7.
- 10,000 followers puts you in the top 8.05 percent, about 1 account in 12. This is the honest answer to what percentage of accounts have 10k followers, and it is higher than most people guess because the guesses are usually anchored on celebrity comparisons.
- 50,000 followers puts you in the top 1.87 percent, about 1 account in 53.
- 100,000 followers puts you in the top 0.90 percent, about 1 account in 111.
- 500,000 followers puts you in the top 0.15 percent.
- 1,000,000 followers puts you in the top 0.07 percent, about 1 account in 1,528.
If you are asking these questions because you are about to buy or sell, rank is only half the answer. A 10,000-follower account is in the top 8 percent of the platform and still routinely changes hands for a few hundred dollars, because price tracks what the audience can be used for, not where it sits in a distribution. The live 2026 X account price guide shows what listings at each tier are actually asking right now. Rank tells you whether a claim is plausible. It does not tell you what to pay.
How we measured the Twitter follower distribution, and what it cannot tell you
This is the section every competing follower-statistics page skips, which is why most of them are not citable. Here is exactly what our data is.
The panel
The index behind our X account directory held 17,639,527 X accounts at query time on 31 July 2026, connected by 76,434,768 recorded follower-graph edges. Accounts enter the index through snowball crawling: we start from seed accounts and expand along follower and following edges. Every cut in this article that is marked as a sample uses a 2 percent random system sample of that index, which returns roughly 350,000 accounts per query. Because each query draws its own sample, the totals differ slightly between cuts: the tier cut returned 357,554 accounts, the posting-activity cut 361,107, and the handle-length cut 354,184. That variation is normal and is why we quote percentages to one or two decimal places rather than pretending to more precision.
The tracking window
Growth figures come from daily snapshots taken between 9 June 2026 and 31 July 2026, a 52-day window. In that period we recorded 323,072 X account snapshots covering 48,962 accounts. Coverage is deliberately uneven. The crawler prioritises large accounts, so the median tracked account has 1,811,025 followers, and the accounts above 100,000 followers account for 274,104 of the day-observations on their own. Any 52-day net-change figure in this article is restricted to accounts with at least 30 tracked days, which leaves 7,901 accounts, precisely because a two-observation account cannot support a trend claim.
What this is not
This is a crawl panel, not a census of X. Nobody outside the company has a census. Three biases follow from that and you should hold all three in mind while reading:
- First, snowball crawling reaches accounts that someone else follows. Accounts with zero graph edges are systematically under-represented, and those accounts have very low follower counts. The real platform-wide distribution is therefore almost certainly more bottom-heavy than ours. In practical terms, our percentiles are conservative: your true rank on the whole platform is probably better than the rank this article gives you.
- Second, the daily-tracking panel is a large-account panel. The growth findings later in this piece describe accounts that are already big. Do not read them as a statement about what a 900-follower account does week to week.
- Third, category labels are inferred from profile text and cover only about 17 percent of sampled accounts. Category cuts therefore describe accounts with descriptive bios, which skews toward accounts that treat themselves as a publication.
What we deliberately excluded
Two columns that would have been useful are not reported here because they are not populated. The legacy verification flag reads zero across every tier, because X retired legacy verification and our crawler no longer receives a value for it. The automation flag is also unpopulated. Citing either would be fabrication, so neither appears in any table below. Where this article says verified, it means the current paid Blue badge and nothing else.
Finally, medians throughout. On a distribution where the top 0.07 percent of accounts hold audiences four orders of magnitude above the median, a mean is a statement about outliers wearing the costume of a statement about typical accounts.
The follower to following ratio is the cleanest scale signal on X
If you can only look at one derived number on a profile, look at the follower to following ratio. It separates tiers more cleanly than any raw count, and unlike a follower count it is difficult to fake without leaving evidence.
| Follower tier | Avg following | Median follower:following | Median lifetime posts | % Blue |
|---|---|---|---|---|
| Under 1K | 547 | 0.63 | 941 | 5.4% |
| 1K to 5K | 1,351 | 2.19 | 5,602 | 12.4% |
| 5K to 10K | 1,941 | 8.54 | 7,176 | 17.0% |
| 10K to 50K | 2,923 | 30.64 | 7,681 | 23.2% |
| 50K to 100K | 5,223 | 131.62 | 9,509 | 34.0% |
| 100K to 500K | 7,943 | 419.65 | 13,788 | 44.2% |
| 500K to 1M | 15,881 | 1,809.91 | 20,532 | 65.0% |
| 1M and above | 14,583 | 5,971.20 | 20,630 | 94.9% |
The median ratio climbs from 0.63 to 5,971.20, a factor of roughly 9,500, across a range where follower counts climb by a factor of about 1,000. The ratio moves faster than the follower count does, and the reason is that the denominator barely moves at all.
You can see this by reconstructing the implied following count at each tier floor. Divide the tier's lower bound by its median ratio and you get roughly 457 accounts followed in the 1K to 5K tier, 586 in 5K to 10K, 326 in 10K to 50K, 380 in 50K to 100K, 238 in 100K to 500K, 276 in 500K to 1M, and 168 above a million. This is a rough reconstruction rather than an exact figure, because the median of a ratio is not the ratio of the medians and because we are using the tier floor rather than the tier median. But the pattern is unmistakable: while followers rise by three orders of magnitude, the number of accounts a typical account follows stays inside a band of a few hundred. Large accounts are not large because they follow more people. They follow slightly fewer.
Compare the median ratio against the average following count in the same row and you learn something else. At 50K to 100K the average account follows 5,223 people, but the median ratio implies a following count around 380. An average that sits an order of magnitude above what the median implies means a minority of mass-following accounts is dragging it. Those accounts exist in every tier, they are the follow-back growth strategy in its natural habitat, and they are the accounts a buyer should price differently.
Two more columns worth reading across. Median lifetime posts rises steadily with size, from 941 below 1,000 followers to 20,630 above a million, so audience and output move together even though the returns flatten badly at the top. And the share of protected accounts falls from 10.09 percent below 1,000 followers to 0.85 percent above a million. Roughly one in ten small accounts is private. Almost no large account is, which is exactly what you would expect if follower count and public reach are the same product.
What an out-of-line ratio tells a buyer
The benchmark only becomes useful when you compare a specific account against its own tier. Here is how the two failure modes read.
A ratio far below the tier median
An account at 50,000 followers with a ratio near 1 is following roughly 50,000 accounts. The tier median is 131.62. That account did not build an audience, it assembled a reciprocity network: it followed tens of thousands of people, some fraction followed back, and the follower number is the residue of that process. The audience has no demonstrated interest in the subject matter, because interest was never the mechanism.
This matters in money terms. Two accounts at 50,000 followers, one with a ratio of 130 and one with a ratio near 1, are not the same asset and should not carry the same price. The first has an audience that chose to be there. The second has a list. Engagement, reply quality, click-through and every downstream monetisation path track the first, not the second. Before you make an offer, run the account through our follower audit tool, and read how to check if an X account has real followers for the manual checks a tool cannot do.
A ratio far above the tier median
A high ratio is usually good, but not always. An account at 20,000 followers that follows 40 accounts has a ratio of 500, roughly 16 times the 10K to 50K tier median of 30.64. That can be a legitimate brand or news account. It can also be a purchased audience, because bought followers arrive without changing the following count, which pushes the ratio up rather than down.
The cross-check is posting history. The median 10K to 50K account has posted 7,681 times. An account at 30,000 followers with 400 lifetime posts is at roughly 5 percent of its tier's median output. That is not automatically fraud, since rebranded and revived accounts exist, but it is a question that needs an answer before money moves. Pair it with the posting-activity benchmarks in the next section and with the full pre-purchase due diligence checklist, which covers the ten metrics worth verifying before a transfer.
The rule we would actually enforce
Do not buy an account whose follower to following ratio is below 1 at 50,000 followers or above. At that scale the tier median is 131.62, and a ratio of 1 is not a variation on the norm, it is a different construction method wearing the same follower number. If the seller has a good explanation, the explanation should be verifiable in the posting history and the reply engagement. If it is not, walk.
Account age cohorts: a 2009 account carries four times the followers of a 2025 one
Account age is the second axis buyers ask about, and the cohort data is more interesting than the folk wisdom. This is the full signup-year breakdown from the same 2 percent sample.
| Created | Accounts in sample | Median followers | P90 followers | Avg posts |
|---|---|---|---|---|
| 2006 | 48 | 2,661 | 33,968 | 12,267 |
| 2007 | 966 | 1,765 | 20,563 | 26,578 |
| 2008 | 3,556 | 1,505 | 18,449 | 23,471 |
| 2009 | 24,959 | 939 | 11,939 | 22,252 |
| 2010 | 23,535 | 768 | 9,300 | 21,686 |
| 2011 | 27,226 | 718 | 8,380 | 19,411 |
| 2012 | 23,702 | 672 | 7,586 | 17,643 |
| 2013 | 19,702 | 647 | 7,382 | 16,588 |
| 2014 | 17,642 | 583 | 6,877 | 16,080 |
| 2015 | 16,635 | 550 | 6,885 | 14,361 |
| 2016 | 15,841 | 543 | 7,222 | 13,471 |
| 2017 | 15,694 | 559 | 7,598 | 13,260 |
| 2018 | 16,277 | 594 | 8,295 | 12,245 |
| 2019 | 18,054 | 603 | 8,478 | 11,532 |
| 2020 | 23,014 | 594 | 8,122 | 10,828 |
| 2021 | 23,349 | 573 | 7,926 | 9,361 |
| 2022 | 24,936 | 468 | 7,045 | 8,582 |
| 2023 | 18,804 | 387 | 5,623 | 7,132 |
| 2024 | 16,490 | 323 | 5,100 | 5,703 |
| 2025 | 14,987 | 231 | 4,115 | 3,422 |
| 2026 | 9,379 | 124 | 2,645 | 1,090 |
The headline comparison is 2009 against 2025: a median of 939 followers versus 231, a factor of 4.06. At the ninetieth percentile the gap is narrower, 11,939 against 4,115, a factor of 2.90. Age helps the typical account more than it helps the strong one, which makes sense: a strong new account can compound quickly, while an average new account is competing for attention in a far more crowded room than 2009 offered.
The middle of the range is flat, and the market prices it as if it is not
Here is the finding that cuts against the standard aged-account pitch. The decline is not monotonic. Median followers fall from 1,505 in 2008 to a floor of 543 in 2016, then rise again through 2017, 2018 and 2019, peaking at 603 for the 2019 cohort, before falling off a cliff after 2021. A 2019 account has a higher median follower count than a 2014, 2015, 2016 or 2017 account. Across the ten cohorts from 2012 to 2021, medians sit in a band from 543 to 672, a spread of 24 percent over a decade of signup years.
That means the age premium in follower terms is real at the extremes and close to nonexistent in the middle. Paying a large premium for a 2014 account over a 2019 account is not supported by anything in this table. If age is worth money to you, it should be for reasons other than raw follower count: a handle that was available then and is not now, a posting history that reads as continuous, or a survivorship record that suggests the account will not trip a review. Our companion piece on why account age beats follower count makes that argument in full, and the data here should be read as the boundary condition on it rather than as a contradiction.
One more caution. Our own live listings show median asking prices per 1,000 followers of $63.78 for accounts under a year old and $30.20 for accounts over ten years old, which looks like older accounts selling at a discount. They are not. Older listed accounts are also larger, with a median of 4,667 followers against 1,017 for the under-one-year band, and price per 1,000 followers falls as size rises. That is a composition effect and nothing more. Do not let anyone quote it at you as evidence that age is cheap.
What a follower count cost in each era: the posting collapse
The posting column in the cohort table falls harder than the follower column, and that comparison is the most useful thing in it. Average lifetime posts drop from 22,252 for the 2009 cohort to 3,422 for the 2025 cohort, a factor of 6.50. Median followers drop by a factor of 4.06 over the same span. Posting fell faster than following did.
Divide one by the other and the direction reverses. The 2009 cohort shows about 0.042 median followers per average post; the 2025 cohort shows about 0.068, roughly 1.6 times more. That calculation mixes a median with a mean and should be read as directional only, but the direction is worth sitting with: newer cohorts are not less effective per unit of work. They convert output into audience at a better rate. What they lack is time on the clock and the tailwind of an emptier platform.
The practical consequence for anyone valuing an account: do not treat a high lifetime post count as proof of quality. It is largely a proxy for age. A 2011 account with 19,000 posts and 700 followers has been running for fifteen years at a rate that produced almost nothing. A 2023 account with 7,000 posts and 700 followers did the same job in three years. If you are buying for future output, the second account tells you more about what the operator can do.
There is a survivorship caveat here that nobody mentions. Old accounts in our index are the old accounts that still exist and are still followed by someone. Accounts from 2009 that were abandoned, suspended or deleted are not in the panel. Every age cohort earlier than about 2015 is therefore a survivor cohort, and survivor cohorts always look stronger than the population they came from. The 2026 row carries a different caveat: it is a partial year, so its average of 1,090 posts represents at most seven months of activity and is not comparable to a full-year cohort.
Verification is U-shaped by cohort and near universal at the top
Blue adoption by follower tier is straightforward: 5.4 percent below 1,000 followers, rising steadily to 94.9 percent above a million. By signup cohort it is not straightforward at all.
| Created | Accounts in sample | % carrying Blue |
|---|---|---|
| 2006 | 48 | 20.8% |
| 2009 | 24,959 | 9.2% |
| 2011 | 27,226 | 7.3% |
| 2013 | 19,702 | 6.6% |
| 2014 | 17,642 | 6.6% |
| 2016 | 15,841 | 7.2% |
| 2018 | 16,277 | 7.6% |
| 2020 | 23,014 | 8.4% |
| 2022 | 24,936 | 11.8% |
| 2024 | 16,490 | 15.5% |
| 2026 | 9,379 | 21.0% |
The curve is a U. It starts at 20.8 percent for 2006 signups, falls to a trough of 6.6 percent for the 2013 and 2014 cohorts, and climbs back to 21.0 percent for 2026 signups. The 2006 cell holds only 48 accounts, so treat that specific number gently, but the shape holds across the much larger cells on either side of the trough.
The U describes two entirely different populations buying the same badge for opposite reasons. At the old end are accounts with an identity worth defending: a handle, a history, a name that people search for, and a subscription that protects the reach attached to it. At the new end are accounts that subscribed at or near signup because reach is what they came for and paying is the fastest way to get it. In the middle sit the 2013 and 2014 cohorts, the people who joined X because everyone was joining X, stayed, and never had a commercial reason to pay.
For a buyer, this makes Blue status mean different things at different sizes. Below 10,000 followers, a Blue badge is a subscription anyone can buy and tells you almost nothing about the account. Above 100,000, the calculus inverts: 44.2 percent of the 100K to 500K tier carries it, 65.0 percent of 500K to 1M, and 94.9 percent above a million. At the top tier an account without Blue is roughly a one in twenty exception, about 12 accounts out of the 234 in our sample. That is not disqualifying, but it is unusual enough that you should ask why. The most common benign answer is an institutional account with a procurement problem. The least benign is an account that has had a subscription cancelled or refused.
What a badge is actually worth in transaction terms is a separate question with its own data, covered in what verification is actually worth when you buy an account. What matters for benchmarking is only this: compare the badge against the tier, never against the platform.
Posting activity versus audience, and the dormancy problem
Follower count is a stock. Posting is a flow. The relationship between them is one of the clearest signals in the dataset and one of the most useful for spotting an account that is not what it looks like.
| Lifetime posts | Accounts | Share of sample | Median followers | % Blue |
|---|---|---|---|---|
| 0 | 5,764 | 1.6% | 9 | 2.3% |
| 1 to 9 | 13,288 | 3.7% | 22 | 3.1% |
| 10 to 99 | 36,914 | 10.2% | 81 | 5.2% |
| 100 to 999 | 84,777 | 23.5% | 284 | 7.9% |
| 1K to 10K | 129,925 | 36.0% | 733 | 10.4% |
| 10K and above | 90,439 | 25.0% | 1,617 | 13.7% |
Start with the extreme. 5,764 accounts in this sample of 361,107 have never posted at all, and their median follower count is 9. Scaled to the full index that is roughly 280,000 accounts that exist, are followed by someone, and have produced nothing. They are 1.6 percent of the sample. Add the accounts with fewer than ten lifetime posts and you are at 5.3 percent. These accounts are the reason any claim about the average X user is meaningless: a meaningful share of the platform is not a user in any behavioural sense.
Now the gradient. Median followers move 9, 22, 81, 284, 733, 1,617 as posting rises. Every band is a genuine improvement on the one below, but the multipliers shrink: 2.4 times, 3.7 times, 3.5 times, 2.6 times, and finally 2.2 times. Going from 1,000 lifetime posts to 10,000 or more, roughly a tenfold increase in output, buys 2.2 times the median audience. The first thousand posts do far more than the tenth thousand. That is the shape of a saturating return, and it is the quantitative form of an observation every long-running account owner already has: at some point posting more stops being the lever.
Reading dormancy on a listing
Cross-reference this table against the tier medians and you have a two-sided test. The median 5K to 10K account has posted 7,176 times; the median 50K to 100K account 9,509 times. If a listing claims 60,000 followers on 900 lifetime posts, the account is roughly 9 percent of its tier's median output. There are three explanations and you should insist on knowing which one applies: the account was rebranded from a previous identity and its posts were deleted, the audience was purchased, or the growth came from something outside normal posting, such as a viral moment or a cross-platform funnel.
None of those is automatically disqualifying, but they carry different risks and different prices. A rebranded account brings whatever history the previous identity had. A purchased audience brings no engagement. A viral-origin audience is real but frequently mismatched to whatever you plan to do with it. Check current activity with our engagement rate calculator and, if reach looks suppressed relative to follower count, run a shadowban check before you agree a price. An account that is invisible in search is not worth its follower count no matter how the follower count was built.
Category benchmarks: crypto is the youngest and most verified corner of X
Platform-wide medians are the wrong benchmark for a specific account. Category medians are better. Here is the full category cut from the same sample, covering the 61,652 sampled accounts that carry a category label.
| Category | Accounts | Median followers | P90 followers | % Blue |
|---|---|---|---|---|
| politics | 7,270 | 944 | 10,084 | 14.5% |
| news | 6,712 | 1,230 | 14,238 | 12.4% |
| sports | 6,608 | 895 | 10,071 | 14.7% |
| crypto | 5,588 | 1,075 | 12,245 | 34.0% |
| music | 5,345 | 772 | 7,936 | 7.4% |
| education | 4,622 | 771 | 7,315 | 9.5% |
| business | 4,345 | 830 | 9,217 | 14.7% |
| design | 2,895 | 681 | 6,532 | 10.7% |
| movies | 2,681 | 842 | 10,099 | 10.3% |
| gaming | 2,526 | 698 | 9,441 | 15.2% |
| tech | 2,455 | 736 | 5,658 | 16.5% |
| science | 1,923 | 776 | 6,703 | 13.7% |
| travel | 1,493 | 786 | 9,088 | 8.6% |
| memes | 1,493 | 857 | 11,210 | 16.6% |
| health | 1,408 | 846 | 9,721 | 9.3% |
| finance | 1,234 | 1,015 | 11,013 | 27.7% |
| anime | 1,130 | 951 | 15,165 | 12.4% |
| programming | 1,059 | 700 | 6,754 | 18.3% |
| ai | 669 | 878 | 9,689 | 25.4% |
| deals | 196 | 1,262 | 18,806 | 19.4% |
Blue adoption varies by a factor of nearly five across categories. Crypto leads at 34.0 percent, followed by finance at 27.7 percent and AI at 25.4 percent. Music is lowest at 7.4 percent, with travel at 8.6 percent and health at 9.3 percent close behind. The pattern is commercial rather than cultural: categories where reach converts directly into revenue buy reach. Crypto is also the youngest category in the index, with a median signup year of 2021 against 2013 for news. Both facts belong together. A category that formed recently and monetises attention aggressively is a category where nearly everyone pays for distribution. You can browse the live ranking in our crypto X account directory, and the buyer-side view of that vertical is in crypto and Web3 X accounts.
Concentration differs more than size does
Compare the P90 column against the median column and you get a rough concentration measure, that is, how far the top decile sits above the typical account. Anime is the most concentrated at 15.9 times, followed by deals at 14.9 times and gaming at 13.5 times. Tech is the flattest at 7.7 times, then science at 8.6 times and education at 9.5 times.
That is a practical difference. In tech, a mid-sized account is comparatively close to the ceiling of its category, so buying at 5,000 followers puts you 6.8 times above the category median and genuinely in contention. In anime or gaming, the same 5,000 followers leaves you far from where the attention actually pools, because those categories concentrate hard into a small number of very large accounts. Buying into a winner-take-all category at mid size is a harder path than the follower number suggests.
The same logic applies to how you read any single listing. A 5,000-follower tech account is 6.8 times its category median. A 5,000-follower news account is only 4.1 times the news median of 1,230, because news accounts start larger. Same follower count, different competitive position, and in practice different value. Which vertical actually commands the highest prices is a separate analysis, set out in our X account niche value guide.
Language benchmarks: English is the biggest market, not the densest
Language is the axis buyers most often ignore and most often should not. Here is the top fifteen by account count in the sample.
| Language | Accounts in sample | Median followers |
|---|---|---|
| English | 137,734 | 843 |
| Japanese | 26,878 | 869 |
| Spanish | 26,367 | 631 |
| Arabic | 10,233 | 974 |
| Portuguese | 9,795 | 618 |
| French | 5,828 | 682 |
| Turkish | 4,614 | 765 |
| German | 3,725 | 728 |
| Italian | 3,336 | 611 |
| Indonesian | 3,272 | 531 |
| Korean | 2,346 | 1,185 |
| Catalan | 2,190 | 757 |
| Thai | 1,350 | 1,890 |
| Dutch | 1,292 | 719 |
| Norwegian | 1,251 | 763 |
English dominates on volume with 137,734 sampled accounts, 5.1 times the next largest language. On median follower count it ranks fifth. Thai accounts carry a median of 1,890 followers, 2.2 times the English median of 843. Korean sits at 1,185 and Arabic at 974. Japanese, at 869, edges out English despite being a fraction of its size. At the other end, Indonesian accounts carry a median of 531 and Italian 611.
Two readings, and the honest answer involves both. The first is real: smaller language communities on X are more concentrated, so the accounts that exist inside them are more likely to be genuine nodes rather than lurkers. The second is a panel artefact: our crawler reaches non-English accounts largely through follower edges from accounts that are already well connected, so the thin-language cells skew toward well-connected accounts. Thai has only 1,350 accounts in this sample, which is enough to report and not enough to bet on. Treat English, Japanese and Spanish as robust cells and everything below Arabic as indicative.
The buying implication is straightforward and frequently ignored. A 5,000-follower Spanish account sits 7.9 times above its language median; a 5,000-follower Thai account sits only 2.6 times above its own. More importantly, an audience is only worth what you can do with it. Do not pay an English-market premium for an audience in a market you cannot sell into, and do not dismiss a smaller-language account whose audience happens to be exactly the one you need. You can browse language-filtered rankings directly, starting with English X accounts, and the same filter exists for every other major language in the index.
Handle length: four characters or fewer is one account in 900
Handles are the one part of an X account that is genuinely finite, and scarcity there is measurable. This cut returned 354,184 sampled accounts.
| Handle length | Accounts in sample | Share of sample |
|---|---|---|
| 2 characters | 3 | under 0.01% |
| 3 characters | 66 | 0.019% |
| 4 characters | 319 | 0.090% |
| 5 characters | 2,765 | 0.78% |
| 6 characters | 10,483 | 2.96% |
| 7 characters | 20,135 | 5.68% |
| 8 characters | 30,925 | 8.73% |
| 9 characters | 38,181 | 10.78% |
| 10 characters | 42,570 | 12.02% |
| 11 characters | 44,080 | 12.45% |
| 12 characters | 43,273 | 12.22% |
| 13 characters | 39,708 | 11.21% |
| 14 characters | 35,813 | 10.11% |
| 15 characters | 45,863 | 12.95% |
Handles of four characters or fewer are 388 accounts out of 354,184, which is 0.11 percent, or roughly 1 account in 900. Five characters or fewer is 3,153 accounts, 0.89 percent, so fewer than one account in a hundred has a handle of five characters or shorter. Two-character handles appear three times in a sample of over a third of a million.
The distribution has a second feature worth noticing: 15 characters is the single most common bucket at 12.95 percent, more common than 14, 13 or 12. That is the signature of a ceiling. The longest handles in the index run to 15 characters, and names bunch up against the limit because people write out full names and phrases until they run out of room.
Scarcity is not the same as value, and this is where handle discussions usually go wrong. A four-character handle attached to a dormant account with 200 followers is a name, not an audience, and it should be priced as a name. The two assets are separable and the market treats them separately. Our listing data does not isolate handle length as a price variable, so we cannot put a number on the handle premium, and neither can anyone else who has not measured it. What we can tell you is the underlying supply constraint, which is what the table above is. The rules around what X itself does with handles, and why you cannot simply resell yours, are covered in our explainer on the X handle marketplace.
Most large X accounts are shrinking, and your benchmark has to account for it
A follower count is a photograph. The daily tracking panel turns it into a film, and the film is less flattering. Across 274,104 day-observations of accounts above 100,000 followers, the median daily change is minus 23 followers. The ninetieth percentile day is plus 778. On 63.9 percent of tracked days, the account ended with fewer followers than it started with.
Over the full 52-day window, restricted to the 7,901 accounts with at least 30 tracked days, 36.7 percent grew and 63.3 percent shrank. The median net change was minus 0.06 percent. The ninetieth percentile was plus 1.13 percent and the tenth percentile was minus 0.22 percent.
Read those two facts together and the mechanism is clear. Losses are frequent and small. Gains are rarer and larger: the upside tail is roughly five times the size of the downside tail. A large account bleeds a little most days and occasionally gains a lot. That is why the daily median is negative while the distribution still contains real winners.
| Category | Accounts tracked | % that grew | Median % change | P90 % change |
|---|---|---|---|---|
| tech | 33 | 60.6% | +0.171% | +32.49% |
| news | 560 | 57.3% | +0.039% | +2.51% |
| sports | 379 | 45.4% | -0.041% | +2.42% |
| politics | 272 | 39.7% | -0.050% | +1.78% |
| science | 57 | 36.8% | -0.064% | +0.73% |
| gaming | 77 | 44.2% | -0.076% | +4.96% |
| education | 90 | 31.1% | -0.083% | +0.52% |
| movies | 155 | 27.7% | -0.087% | +0.84% |
| business | 157 | 31.8% | -0.088% | +1.70% |
| music | 217 | 27.6% | -0.094% | +1.02% |
| design | 30 | 33.3% | -0.107% | +0.46% |
| memes | 61 | 31.1% | -0.112% | +1.87% |
| crypto | 120 | 26.7% | -0.132% | +2.53% |
Only two categories posted a positive median over the window: tech at plus 0.171 percent and news at plus 0.039 percent. The tech cell holds 33 accounts and the design cell 30, both too thin to lean on, so the finding we would actually defend is the news one: with 560 tracked accounts, news is the only large category where the median tracked account gained followers, and 57.3 percent of them grew.
Crypto was the worst performer of the robust cells. Of 120 tracked crypto accounts, 26.7 percent grew and the median lost 0.132 percent. We sell crypto accounts and we are telling you the category shrank over our measurement window, because the alternative is that you find out after you have paid. Note the countervailing detail: crypto's ninetieth percentile was plus 2.53 percent, the third highest in the table, so the category still contains genuine winners. It is a high-variance category, not a dead one.
The magnitudes here are small and the window is 52 days, so do not extrapolate them into an annual figure. Direction is the finding, not size. If you are modelling a purchase, model flat. Assume the audience you can verify today is the audience you are buying, and treat any growth as upside you did not pay for. The full decay study across X, Telegram and the other platforms we index is in most social accounts are shrinking, which works through the same question at platform scale.
What these follower count benchmarks are worth in money
Benchmarks matter because they set the reference point for a price. Here is where our live marketplace sits against them. At query time there were 345 active X listings with a 25th percentile asking price of $25, a median of $100, a 75th percentile of $300 and a maximum of $100,000. The median completed deal on the platform settles at $40 and takes 23 hours from creation to completion.
| Follower tier | Listings | Median asking price | Median $ per 1K followers | Median age (days) |
|---|---|---|---|---|
| Under 1K | 101 | $15 | $550.00 | 651 |
| 1K to 5K | 101 | $100 | $45.05 | 1,443 |
| 5K to 10K | 35 | $95 | $13.94 | 2,419 |
| 10K to 50K | 60 | $250 | $13.05 | 1,622 |
| 50K to 100K | 17 | $670 | $7.05 | 500 |
| 100K and above | 21 | $6,500 | $34.61 | 1,737 |
Unit price does not fall smoothly. It collapses from $45.05 per 1,000 followers in the 1K to 5K tier to $7.05 in the 50K to 100K tier, a factor of 6.4, and then rebounds to $34.61 above 100,000. The sub-1K figure of $550 per 1,000 is an artefact of the price floor: a $15 minimum listing divided by a few hundred followers produces a nonsense unit rate. Ignore that row for unit-cost purposes.
The interesting cell is 50K to 100K. On the distribution side, that tier is 0.98 percent of all indexed accounts, so it is genuinely scarce. On the price side it is the cheapest audience per follower on the marketplace, with only 17 listings. Scarce and cheap at the same time is unusual, and the explanation is that the tier sits in a gap: too large for the buyers who shop on absolute price and want something under $100, too small for the buyers who are paying for prestige above 100,000. If you are buying reach as a commodity, that is where the unit economics are best.
Category price against category benchmark
Our category price cut has a sample-size problem that we will state before the numbers: only two cells are robust. Personal accounts (179 listings) show a median of $67.23 per 1,000 followers, and crypto accounts (85 listings) show $34.92. News (4 listings), sports (6) and other (9) are too thin to generalise from and we would not quote them at you.
So crypto accounts sell for roughly half the unit price of personal accounts. Part of that gap is size composition and not category preference: the median listed crypto account carries 4,639 followers against 1,319 for personal accounts, and unit price falls with size everywhere. But part of it lines up with the index data. Crypto has the highest Blue adoption on X at 34.0 percent, meaning distribution is bought rather than earned across the category, and it was the weakest robust category in our 52-day tracking at minus 0.132 percent median. A market discounting crypto audiences is not obviously making a mistake.
Using benchmarks on a specific listing
A workable sequence when you are looking at a real account, in order:
- One. Place the follower count in its tier and note the percentile. This tells you whether the account is rare enough to justify a scarcity argument.
- Two. Compare the follower to following ratio against the tier median in the table earlier in this article. Below the median by a wide margin means a reciprocity-built audience.
- Three. Compare lifetime posts against the tier median. Far below means rebranded, purchased, or externally grown, and you need to know which.
- Four. Compare followers against the category median rather than the platform median, because a 5,000-follower news account and a 5,000-follower tech account are in different competitive positions.
- Five. Check the language of the audience against the market you intend to sell into.
- Six. Assume flat growth, because 63.3 percent of tracked large accounts shrank over our window.
- Seven. Only then apply a price. The X account valuation guide turns those inputs into a number and shows which attributes carry the most weight.
The order matters. Most buyers start at step seven, anchor on the asking price, and then look for reasons the account justifies it. Working from distribution to price rather than price to justification is the whole point of having benchmarks at all.
Frequently asked questions
What is the average number of followers on X?
The average is a misleading statistic here and we would encourage you not to use it. In our 2009 cohort the mean is 15,604 followers against a median of 939, a gap of 16.6 times, because a handful of enormous accounts pull the mean upward. The median is the number that describes a typical account, and across our 17.6 million account index the median sits below 1,000 followers: 61.1 percent of sampled accounts fall in the under-1K tier. If someone quotes you a single average follower figure for X, ask what year it came from and what the median was.
Is 1,000 followers good on X?
It puts you ahead of 61.1 percent of indexed accounts, so yes in rank terms, though it is not rare. The more meaningful change at 1,000 is structural: below that line the median account has a follower to following ratio of 0.63, meaning it follows more accounts than follow it, and in the 1K to 5K tier the median ratio is 2.19. Crossing 1,000 is where an account typically stops consuming more than it produces. Commercially, 1,000 followers is a starting point rather than an asset. Listings in the 1K to 5K tier on our marketplace ask a median of $100.
What percentage of X accounts have 10,000 followers?
8.05 percent of accounts in our 2 percent sample sit at or above 10,000 followers, roughly 1 in 12. Scaled to the full index that is about 1.42 million accounts. Because our panel under-represents accounts with no follower-graph connections, the true platform-wide share is likely lower than 8 percent, so treat this as an upper bound on the share and a conservative estimate of your own percentile.
What is a good follower to following ratio on X?
There is no universal good ratio, only a ratio that is normal for a given size. The median by tier runs 0.63 under 1,000 followers, 2.19 at 1K to 5K, 8.54 at 5K to 10K, 30.64 at 10K to 50K, 131.62 at 50K to 100K, 419.65 at 100K to 500K, 1,809.91 at 500K to 1M and 5,971.20 above a million. Compare an account against its own tier. A ratio of 5 is healthy at 2,000 followers and a serious warning sign at 50,000.
What is the average age of an X account?
Cumulating the signup cohorts in our sample, the median indexed account was created in 2017, making the typical account about nine years old. The distribution is broad: 28.0 percent of sampled accounts were created in 2012 or earlier, and 23.8 percent were created in 2022 or later. Median account age also falls as size rises, from a median creation year of 2017 in the sub-1K tier to 2010 above a million followers.
Do older X accounts really have more followers?
At the extremes yes, in the middle barely. A 2009 account carries a median 939 followers against 231 for a 2025 account. But across the ten cohorts from 2012 to 2021 the medians sit between 543 and 672, a spread of 24 percent, and the 2019 cohort actually outperforms 2014, 2015, 2016 and 2017. Two further caveats apply: older cohorts in any crawl are survivor cohorts, since the abandoned and suspended accounts of that era are no longer indexable, and price per 1,000 followers falls with account size, so any age-versus-price comparison is confounded by the fact that older listed accounts are also larger.
How many X accounts have never posted?
1.6 percent of our posting-activity sample, 5,764 accounts out of 361,107, have zero lifetime posts, and their median follower count is 9. Roughly 5.3 percent have fewer than ten posts. Scaled to the index, that is on the order of 280,000 accounts that exist and are followed by somebody while producing nothing at all.
Where to take these numbers next
If you are benchmarking your own account, the three numbers to write down are your tier percentile, your follower to following ratio against your tier median, and your lifetime post count against your tier median. Those three place you honestly, and they are the same three a serious buyer will check first.
If you are valuing an account to buy or sell, start from the distribution rather than the asking price. Our valuation tool is free and takes about a minute, and the marketplace shows what comparable accounts are actually listed at rather than what people say they are worth. Every transaction there runs through escrow, so the benchmark work you do up front is protected by the process that follows it.
Free tools for this topic

Published by the PlayerSells editorial team. Data comes from PlayerSells marketplace records and our own crawlers. About PlayerSells · Editorial policy
Related Articles
Continue learning with these related guides.
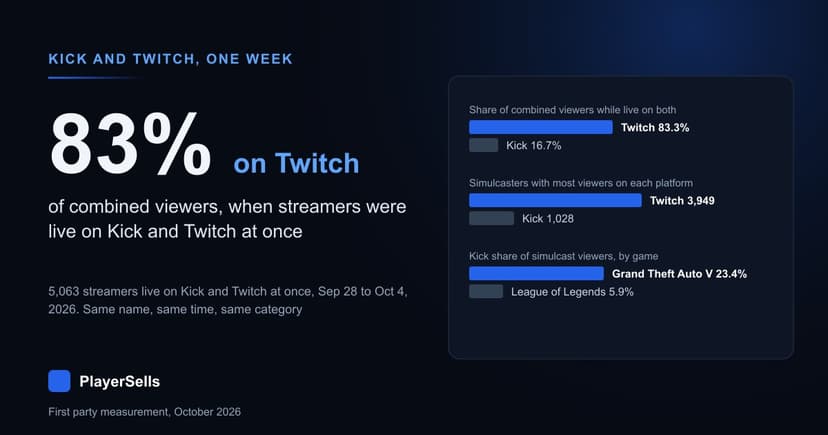
Kick and Twitch Simulcasts: 83% of Viewers Watch on Twitch
5,063 streamers went live on Kick and Twitch at once from Sep 28 to Oct 4, 2026. Twitch drew 83% of their combined viewers and Kick 17%.
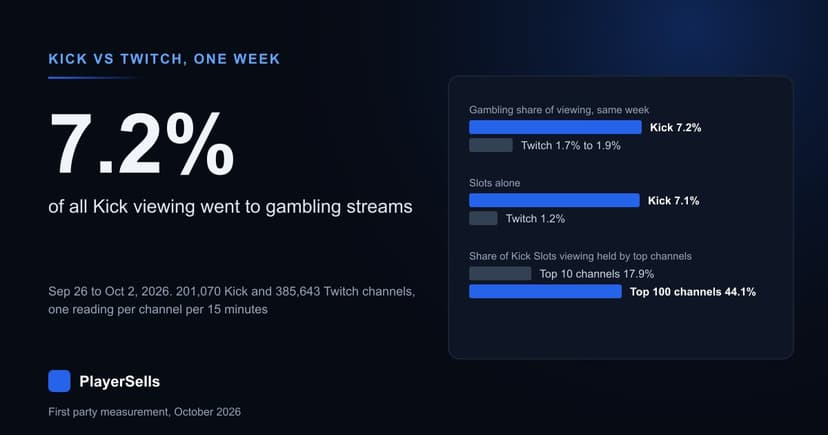
How Much of Kick Is Gambling? One Week vs Twitch
Gambling took 7.2% of Kick viewing from Sep 26 to Oct 2, 2026, across 201,070 channels. Twitch's gambling categories took 1.7% to 1.9% the same week.
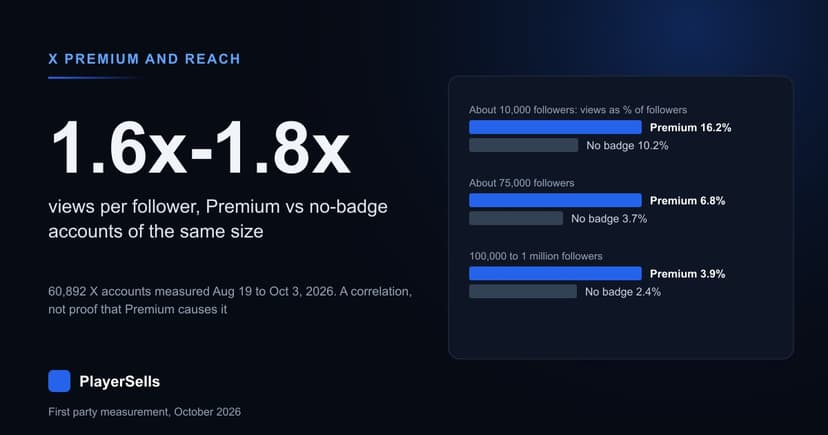
X Premium Linked to 1.6x-1.8x More Reach at the Same Size
Across 60,892 X accounts, Premium posts drew 1.6x to 1.8x the views per follower of no-badge accounts the same size. A correlation, not proof of cause.