

How Fast Do TikTok Accounts Actually Grow? 9,559 Measured
We measured 9,559 TikTok accounts over 64 days: 64.47 percent grew, the median gained 3.63 percent, and the average overstated that by 125 times.
Across 179,404 end-of-day snapshots of 12,504 TikTok accounts recorded between 2026-06-24 and 2026-08-26, the median TikTok account below one million followers that we could measure across a full window gained 100 followers. The mean gained 6,288.8. That gap of 62.9 times is the reason almost every published TikTok growth benchmark is wrong in a predictable direction. Those benchmarks report an average, and in our measured sample only 13.59 percent of accounts reached the average.
PlayerSells runs its own TikTok crawler for the PlayerSells account directory. It captured 500,345 raw profile reads between 2026-06-24 20:14 UTC and 2026-08-27 01:21 UTC, which our engine rolled into 179,404 end-of-day rows at an average of 2.789 raw captures per account-day. This article reports what those snapshots say about how TikTok accounts actually move: how many grew, how much, who captured the growth, how posting frequency relates to it, and what a defensible engagement benchmark looks like when you measure it instead of surveying for it.
One finding reframed everything else in this article, so we lead with it rather than bury it in a methods note. TikTok does not publish an exact follower count for large accounts. We measured the quantization directly: across 60,476 end-of-day snapshots of accounts above 1,000,000 followers taken before 2026-08-24, 100.00 percent of the values were exact multiples of 100,000. Any growth figure for a large TikTok account that claims precision below 100,000 followers is measuring rounding, not people. We explain how we handled that below, and every number in this article is computed on a cohort where the measurement scale does not change mid-window.
How many TikTok accounts actually grew over 64 days?
In our measured cohort of 9,559 TikTok accounts, 64.47 percent gained followers, 19.56 percent lost followers, and 15.96 percent recorded no change at all, over a median observed span of 53 days. The cohort is every account in our index with at least two end-of-day snapshots spanning 45 days or more, restricted to snapshots taken before 2026-08-24 so that the follower values are all on the same measurement scale. Growth is measured as the difference between an account's first and last snapshot in that window, not as a modelled rate.
That result matters because it runs against the cross-platform pattern. Our own analysis of six million daily snapshots across several networks found that most indexed social accounts shrink over a comparable window. TikTok, measured on the same kind of data by the same engine, does not behave that way. Roughly two thirds of the TikTok accounts we track gained followers over a median 53 days, and only one in five lost them. If you have been told that social growth is over everywhere, TikTok is the platform where that generalisation breaks.
The growth rate is not evenly distributed across account sizes, and the direction of the gradient is the opposite of what a lot of buyer advice implies. Small TikTok accounts grew fastest in percentage terms and largest accounts barely moved. The table below breaks the 9,559-account cohort by the follower count each account had at its first snapshot.
| Starting followers | Accounts | Grew | No change | Shrank | Median growth | P75 growth | P90 growth | Mean growth | Median followers added |
|---|---|---|---|---|---|---|---|---|---|
| Under 1,000 | 2,475 | 72.57% | 13.90% | 13.54% | 12.24% | 73.68% | 331.34% | 1,438.23% | 14 |
| 1,000 to 9,999 | 2,170 | 75.39% | 1.01% | 23.59% | 3.79% | 21.09% | 75.14% | 39.81% | 105 |
| 10,000 to 99,999 | 2,094 | 69.91% | 9.84% | 20.25% | 2.67% | 13.66% | 41.69% | 20.86% | 700 |
| 100,000 to 999,999 | 1,375 | 66.55% | 1.75% | 31.71% | 1.35% | 7.14% | 23.23% | 8.81% | 3,900 |
| 1,000,000 and above | 1,373 | 23.38% | 64.75% | 11.87% | 0.00% | 0.00% | 3.57% | 0.93% | 0 |
Sample: n = 9,487 TikTok accounts with a non-zero starting follower count, drawn from the 9,559-account cohort, measured over a median span of 53 days between 2026-06-24 and 2026-08-23. Median growth is computed with percentile_cont, never as an average.
The bottom row of that table is a measurement artefact and we flag it rather than let a reader misread it. For accounts above 1,000,000 followers, TikTok publishes the follower count rounded to the nearest 100,000, so an account has to gain at least 100,000 followers before the public number moves at all. That is why 64.75 percent of the 1,373 large accounts show no change: not because they were frozen, but because our measurement floor for that band is 100,000 followers. Read that row as "23.38 percent of large accounts moved up by at least one full display step in a median 53 days", which is the only claim the data supports.
For every band below 1,000,000 followers the measurement is much finer. TikTok reports exact counts below 10,000 followers, and counts rounded to the nearest 100 between 10,000 and 999,999. A 20,000-follower account therefore has to gain 100 followers before the public number changes, which is 0.5 percent of the account. All the growth analysis in the rest of this article is restricted to accounts that started below 1,000,000 followers unless we say otherwise.
What did the median TikTok account gain?
The median TikTok account below 1,000,000 followers grew 3.63 percent over a median 51 measured days, which came to 100 followers. That figure comes from 8,114 accounts, of which 71.62 percent grew, 21.04 percent shrank and 7.35 percent did not move. Expressed as a compound rate so that different observation spans are comparable, the median works out at 2.09 percent per 30 days and 28.63 percent per year.
The single most useful thing we can give you from 179,404 snapshots is not a headline average but a percentile ladder, because it lets you place your own account instead of comparing it to a number nobody has. The table below converts every account's observed change into a compound 30-day rate and reports the distribution. If your TikTok account grew 9.43 percent in the last 30 days, you sat at the 70th percentile of our measured population.
| Percentile | Compound 30-day follower growth | What it means |
|---|---|---|
| 5th | -0.70% | Losing followers steadily |
| 20th | -0.04% | Marginally negative |
| 40th | 0.84% | Below the median |
| 50th | 2.09% | The median account |
| 60th | 4.53% | Modestly above average |
| 70th | 9.43% | Clearly growing |
| 80th | 18.51% | Top fifth |
| 90th | 49.09% | Top tenth |
| 95th | 106.06% | Doubling monthly |
| 99th | 532.33% | Viral trajectory |
Sample: n = 8,111 TikTok accounts that started below 1,000,000 followers, each with at least two end-of-day snapshots spanning 45 days or more, all snapshots taken between 2026-06-24 and 2026-08-23. Each account's observed change is converted to a compound 30-day rate before the percentiles are taken.
Two things about that ladder are worth sitting with. The first is how compressed the middle is: the gap between the 40th percentile and the 60th percentile is 0.84 percent to 4.53 percent, which on a 10,000-follower account is the difference between 84 and 453 new followers in a month. Most accounts live inside a very narrow band, and small absolute differences move you several percentile points. The second is how steep the top is: getting from the 90th to the 95th percentile means more than doubling your rate again, from 49.09 percent to 106.06 percent.
If you want to know what the measured median implies over a longer horizon, the arithmetic is simple and we state it as arithmetic rather than as a forecast. At the measured median compound rate of 2.09 percent per 30 days, an account doubles its followers in 33.5 months. Compounding that same 30-day rate twelve times gives 28.17 percent per year, which cross-checks against the 28.63 percent we measured directly by annualising each account's own observed span. Growth rates do not hold constant for three years, so treat 33.5 months as a description of the current median pace, not a plan.
Why does the average TikTok growth rate mislead you?
The mean growth rate across our 8,114 sub-million TikTok accounts was 456.22 percent and the median was 3.63 percent, so the average is 125.7 times the typical account. Only 255 accounts, 3.14 percent of the cohort, actually reached or beat that average. In absolute terms the mean gain was 6,288.8 followers against a median of 100, and 13.59 percent of accounts reached the mean. An average that describes three percent of a population is not a benchmark. It is a summary statistic being asked to do a job it cannot do.
This is not a quirk of our sample. It is what happens to any average computed over a heavy-tailed distribution, and follower growth on TikTok is about as heavy-tailed as distributions get. In our cohort of 8,114 accounts measured between 2026-06-24 and 2026-08-23, the 99th percentile of window growth was 1,858.78 percent while the 25th percentile was exactly 0.00 percent. A handful of accounts that went from nothing to something drag the mean into a region no ordinary account occupies.
The distortion is worst in the smallest band, which is exactly where most people who ask "is my TikTok growing normally" actually sit. Among the 2,475 accounts that started below 1,000 followers, the median grew 12.24 percent and the mean grew 1,438.23 percent, a ratio of 117.5 to one. A single account going from 3 followers to 30,000 does that to an average. If a benchmark article quotes you an average TikTok growth rate without a median beside it, the number is arithmetically true and practically useless.
The same problem contaminates follower-count benchmarks. Across the 12,538 TikTok accounts in our index at 2026-08-27 01:23 UTC, the median follower count was 10,500 and the mean was 1,197,535, a ratio of 114 to one. We publish medians and percentiles throughout this article for that reason, and every median here comes from percentile_cont, never from an average. You can check where your own account falls on our measured distribution with the TikTok follower percentile rank tool, which runs against the same index.
Where did all the growth actually go?
Of the 144,475,871 net new followers our 9,559-account cohort added between 2026-06-24 and 2026-08-23, the top 1 percent of accounts by absolute gain captured 90,771,700, or 62.83 percent of the total. Those 96 accounts took nearly two thirds of the growth of the whole cohort. The ten single largest gainers took 46,946,900 between them, which is 32.49 percent of everything the cohort gained on net.
The concentration is more extreme than the top-heavy figure suggests, because the bottom of the distribution is negative. The top 10 percent of accounts, 960 of them, gained 155,082,859 followers, which is 107.34 percent of the cohort's net total. A share above 100 percent is only possible when the rest of the population is losing. The remaining 8,599 accounts, the bottom 90 percent, collectively lost 10,606,988 followers over the same window.
| Segment | Accounts | Net follower change | Share of cohort net growth |
|---|---|---|---|
| Top 1% by absolute gain | 96 | +90,771,700 | 62.83% |
| Top 10% by absolute gain | 960 | +155,082,859 | 107.34% |
| Bottom 90% by absolute gain | 8,599 | -10,606,988 | -7.34% |
| Ten largest gainers only | 10 | +46,946,900 | 32.49% |
| Whole cohort | 9,559 | +144,475,871 | 100.00% |
Sample: n = 9,559 TikTok accounts with at least two end-of-day snapshots spanning 45 days or more, all snapshots taken between 2026-06-24 and 2026-08-23. Gross gains across the cohort were 163,820,272 followers and gross losses were 19,344,401, netting to 144,475,871.
Concentration this severe changes how you should read any TikTok growth claim that aggregates. When a report says "accounts in this category grew 40 percent on average", the honest translation is usually "two accounts in this category had a very good month". It also explains why percentage-growth leaderboards are dominated by tiny accounts: among the 8,114 sub-million accounts we measured, 139 grew tenfold or more, and those accounts started at a median of 39 followers and finished at a median of 1,969. Growing 10x from 39 followers is real, but it is not the same phenomenon as growing 10x from 39,000.
The distribution of growth by decile makes the same point from the other direction. We split the 8,114 sub-million accounts into ten equal groups ordered by their window growth rate and looked at what each decile actually contained. The fastest decile, 812 accounts that each grew at least 96.05 percent, had a median starting size of 263.5 followers and a median of 58 lifetime videos. The slowest decile, 811 accounts that each lost at least 0.60 percent, had a median starting size of 7,078 followers. Percentage growth is cheapest where the base is smallest, and that is a property of arithmetic before it is a property of TikTok.
Does posting more videos actually grow a TikTok account?
Yes, and the relationship survives a size control, which is the test most growth advice never runs. We measured posting activity independently of follower activity by taking each account's video count from our raw snapshot table at its first and last capture, then dividing the difference by the elapsed time. Restricting to accounts that started between 1,000 and 99,999 followers, so that account size cannot drive the result, median follower growth rose from 0.00 percent for accounts that posted nothing to 14.72 percent for accounts that posted seven or more videos a week.
| Videos posted per week | Accounts | Share that grew | Median growth | P75 growth | Median starting followers |
|---|---|---|---|---|---|
| Zero or net negative | 1,111 | 44.91% | 0.00% | 2.99% | 5,212 |
| Under 1 | 720 | 67.08% | 1.35% | 9.77% | 5,701 |
| 1 to 3 | 764 | 80.50% | 3.81% | 16.11% | 10,100 |
| 3 to 7 | 825 | 86.67% | 7.16% | 23.47% | 11,300 |
| 7 or more | 844 | 93.36% | 14.72% | 49.28% | 14,500 |
Sample: n = 4,264 TikTok accounts that started between 1,000 and 99,999 followers, with posting cadence measured from 500,345 raw profile captures and follower change measured from end-of-day snapshots, all between 2026-06-24 and 2026-08-23. Median starting size varies only 2.78 times across the five rows, so account size is not driving the pattern.
Before you treat that table as a causal instruction, note the confound we cannot remove. Posting cadence and growth are measured over the same window, so we cannot tell you which came first. An account that starts getting reach has an obvious reason to post more, and an account run by a professional team will both post more and grow more for reasons that have nothing to do with cadence itself. Accounts that post more also tend to grow more; we are not claiming that posting more causes the growth.
We can at least quantify how much of the story cadence covers. Inside the same size-controlled cohort of 4,264 accounts, the Spearman rank correlation between posting cadence and follower growth is 0.4451, which means cadence rank explains 19.81 percent of the variance in growth rank. That is a substantial share for a single variable and it leaves roughly four fifths of the variance to everything else: what the videos are about, whether one of them caught the recommendation system, the account's existing audience, and luck.
The baseline for how often accounts actually post is lower than most growth advice assumes. Across 9,558 TikTok accounts with raw captures spanning 45 days or more, the median posted 1.22 videos per week, or 10 new videos across the whole window. The 75th percentile posted 40 new videos and the 90th percentile posted 101. A full 20.91 percent of accounts posted nothing at all during the window, and 866 accounts, 9.06 percent, ended with fewer videos than they started with because they deleted more than they published.
What does posting more cost you per video?
Posting more buys total growth and costs you likes per individual video, and we can measure both sides of that trade from the same snapshots. Among TikTok accounts starting between 1,000 and 99,999 followers that posted at least one new video during the window, the median number of new hearts collected per newly posted video fell from 2,233 for accounts posting under one video a week to 547 for accounts posting more than twenty-one a week.
| Videos posted per week | Accounts | Median new videos | P25 hearts per new video | Median hearts per new video | P75 hearts per new video |
|---|---|---|---|---|---|
| Under 1 | 713 | 4 | 100 | 2,233 | 16,667 |
| 1 to 3 | 761 | 15 | 176 | 1,418 | 10,526 |
| 3 to 7 | 822 | 37 | 151 | 1,303 | 7,143 |
| 7 to 21 | 614 | 86 | 191 | 1,053 | 4,758 |
| Over 21 | 229 | 255 | 121 | 547 | 4,280 |
Sample: n = 3,139 TikTok accounts starting between 1,000 and 99,999 followers that added at least one video and did not lose hearts across the window, measured from raw profile captures between 2026-06-24 and 2026-08-27. Hearts per new video is the change in total hearts divided by the change in video count, so it is an average over the new videos, not a per-video reading.
The direction of that decline is stronger than it looks, because the confound points the other way. Median starting followers rise across the cadence bands, from 5,674 in the lowest to 17,300 in the highest, and larger accounts collect more likes per video. If anything the decline in likes per video with rising cadence is understated by that composition effect. What the two tables together say is that high-cadence accounts win on volume and lose on per-post performance, and the volume wins by enough that total growth still rises.
The interquartile ranges in that table deserve a warning of their own. In the lowest cadence band the 25th percentile is 100 hearts per new video and the 75th percentile is 16,667, a spread of 166.7 times inside a single row. Accounts that post four videos in two months and get a median of 2,233 hearts each are often accounts where one of those four videos did something unusual. Read the medians, treat the row-level spread as the real story, and do not build a content plan on the difference between two adjacent rows.
What is a realistic TikTok engagement rate benchmark?
There is no single realistic TikTok engagement rate benchmark, because the measured distribution moves by more than an order of magnitude across account size. Using lifetime hearts divided by lifetime videos divided by current followers, the median TikTok account below 1,000 followers collects likes equal to 26.75 percent of its follower count per video, while the median account above 1,000,000 followers collects 2.24 percent. Any article that quotes you one number for all of TikTok has averaged across that range.
| Follower band | Accounts | P10 | P25 | Median like rate | P75 | P90 | Mean |
|---|---|---|---|---|---|---|---|
| Under 1,000 | 1,479 | 4.07% | 9.56% | 26.75% | 101.06% | 486.64% | 237.42% |
| 1,000 to 9,999 | 2,656 | 1.76% | 4.85% | 17.06% | 101.58% | 374.90% | 153.52% |
| 10,000 to 99,999 | 2,855 | 1.05% | 2.56% | 7.38% | 25.50% | 80.85% | 41.05% |
| 100,000 to 999,999 | 1,915 | 0.84% | 1.69% | 4.06% | 10.13% | 23.08% | 10.38% |
| 1,000,000 and above | 1,538 | 0.65% | 1.18% | 2.24% | 4.46% | 8.38% | 4.59% |
Sample: n = 10,443 TikTok accounts with at least 10 videos and at least 100 followers, from the 12,538 accounts in our index at 2026-08-27 01:23 UTC. Like rate is lifetime hearts divided by lifetime video count divided by current follower count, expressed as a percentage.
That metric has a real weakness and we would rather name it than let you discover it. It divides a lifetime quantity by a current follower count, so for an account that grew a lot during its life the denominator is bigger than it was when most of those videos were published, and the true rate at the time was higher. The distortion is largest exactly where the numbers are largest: in the under-1,000 band, where the median account grew 12.24 percent in our measured window alone. The band you can trust most is the 1,000,000-plus row at 2.24 percent, because those accounts moved a median of 0.00 percent in our window, so their denominator is close to stable.
Because the lifetime measure has that flaw, we also computed a time-bounded engagement measure that does not need a lifetime denominator at all: the number of new hearts an account collected per 1,000 followers per measured day inside our observation window. It uses only the change in hearts and the follower count at the start, so it is a clean flow measure rather than a stock ratio.
| Follower band | Accounts | P25 | Median new hearts per 1,000 followers per day | P75 | P90 | Accounts with zero or negative heart change |
|---|---|---|---|---|---|---|
| Under 1,000 | 2,475 | 1.50 | 71.57 | 567.17 | 3,754.06 | 530 |
| 1,000 to 9,999 | 2,170 | 4.03 | 40.26 | 278.27 | 1,402.70 | 276 |
| 10,000 to 99,999 | 2,094 | 1.79 | 29.93 | 155.66 | 548.65 | 340 |
| 100,000 to 999,999 | 1,375 | 0.00 | 18.23 | 76.13 | 205.23 | 344 |
| 1,000,000 and above | 1,373 | 0.00 | 1.41 | 8.93 | 37.91 | 382 |
Sample: n = 9,487 TikTok accounts with a non-zero starting follower count, at least two end-of-day snapshots and a span of 45 days or more, all snapshots taken between 2026-06-24 and 2026-08-23. The 1,000,000-plus row is limited by the same 100,000-unit rounding that affects heart totals above one million, so read it as a floor rather than a measurement.
Both measures agree on the shape even though they are computed from different quantities: engagement per follower falls steadily as accounts get larger. That is the single most reliable engagement finding in our TikTok data, and it is the one that a flat platform-wide benchmark hides. If you are comparing your own account against a benchmark, compare it against your own follower band. Our TikTok engagement rate calculator runs the arithmetic against the current index rather than against a survey.
One cross-cutting number is worth adding, because it puts the whole heart economy in proportion. Across the 9,559-account cohort our engine recorded 144,475,871 net new followers and 12,269,487,263 net new hearts between 2026-06-24 and 2026-08-23. That is 84.9 new hearts for every net new follower. Likes are abundant on TikTok in a way they are not on most networks, which is precisely why a like-based engagement rate on TikTok is not comparable to a like-based engagement rate anywhere else.
Which categories earn the most likes per follower?
Among the 17 content categories in our index with at least 30 accounts, travel accounts recorded the highest median lifetime like rate at 18.52 percent of followers per video, and crypto accounts the lowest at 3.30 percent. The gap between the top and bottom category is 5.6 times, which is smaller than the gap between the smallest and largest follower bands, so category matters less than size. It is still a real signal, and it points in a consistent direction: entertainment categories out-engage information categories.
| Category | Accounts | Median followers | Median like rate | Median videos |
|---|---|---|---|---|
| Travel | 108 | 21,700 | 18.52% | 303 |
| Anime | 107 | 4,296 | 18.49% | 152 |
| Sports | 372 | 17,022 | 11.24% | 253 |
| Deals | 34 | 27,150 | 11.13% | 348 |
| Movies | 156 | 11,200 | 10.37% | 161 |
| Gaming | 129 | 24,000 | 10.09% | 268 |
| Music | 249 | 77,988 | 9.46% | 488 |
| Memes | 210 | 24,800 | 8.30% | 255.5 |
| Politics | 113 | 15,800 | 7.92% | 218 |
| Design | 57 | 6,169 | 6.98% | 184 |
| Tech | 68 | 3,422.5 | 6.71% | 140.5 |
| Business | 321 | 25,100 | 6.57% | 280 |
| Health | 257 | 25,500 | 5.93% | 383 |
| Science | 42 | 18,700 | 5.12% | 265.5 |
| Education | 100 | 69,689.5 | 3.89% | 390 |
| News | 250 | 54,423.5 | 3.38% | 496.5 |
| Crypto | 145 | 10,700 | 3.30% | 283 |
Sample: n = 2,718 TikTok accounts across 17 categories with at least 30 accounts each, out of 2,786 categorised accounts in an index of 12,538 at 2026-08-27 01:23 UTC. Every category with fewer than 30 accounts is excluded rather than shown. Category is present on only 22.2 percent of the index, so this table describes the categorised subset, not the whole population.
The confound in that table is visible in its own columns, which is why we printed them. Education, news and music accounts are much larger at the median than anime or tech accounts, and like rate falls with size, so part of the category gap is a size gap wearing a costume. Education accounts sit at a median 69,689.5 followers and news at 54,423.5, against 4,296 for anime and 3,422.5 for tech. Read the table as a description of the categorised accounts we index, not as an instruction to switch niches.
Posting volume also tracks category in a way worth noticing. News accounts carry a median of 496.5 lifetime videos and music accounts 488, against 140.5 for tech and 152 for anime. Categories where the content is a stream of events produce far more videos per account than categories where the content is a stream of ideas, and that alone changes what a lifetime average per video means.
How many indexed TikTok accounts are quietly dormant?
Of the 9,559 TikTok accounts we measured across a full window, 10.44 percent collected no new likes at all and 3.77 percent recorded neither a new like nor a net follower change. Those 998 zero-heart accounts are still visible, still followed and still indexed, but nothing happened to them across a median 53 days. A separate and independent measurement from our raw capture table agrees: 20.91 percent of accounts posted no new video during the window.
The gap between those two dormancy rates is informative rather than contradictory. An account can stop posting and keep accumulating likes on its back catalogue, which is why more accounts stopped posting (20.91 percent) than stopped collecting likes (10.44 percent). The stricter definition, zero new likes across roughly two months, is the one we would use for judging whether an account is alive.
The most useful cut of this data is the four-way split between what happened to an account's followers and what happened to its likes, because the two off-diagonal cells are where the interesting accounts live.
| Pattern | Accounts | Share | Median starting followers | Median follower change | Median heart change |
|---|---|---|---|---|---|
| Followers up and hearts up | 5,496 | 67.73% | 4,122 | +500 | +28,729 |
| Neither up | 1,175 | 14.48% | 5,289 | -7 | 0 |
| Hearts up, followers flat or down | 1,128 | 13.90% | 9,536 | -18.5 | +1,200 |
| Followers up, hearts flat or down | 315 | 3.88% | 6,156 | +100 | 0 |
Sample: n = 8,114 TikTok accounts that started below 1,000,000 followers with at least two end-of-day snapshots spanning 45 days or more, all snapshots taken between 2026-06-24 and 2026-08-23. The Spearman rank correlation between follower change and heart change across this cohort is 0.7539.
The bottom row is the one to look at if you are evaluating an account you did not build. Those 315 accounts, 3.88 percent of the cohort, added a median of 100 followers while collecting zero additional likes over roughly two months. Followers arriving without any corresponding engagement is one of the patterns that follower-authenticity checks are built to catch, though it is not proof of anything on its own: an account that deletes its videos loses their likes and can show the same signature. If you are assessing a real account, run a follower authenticity audit rather than inferring from one ratio.
The third row, 1,128 accounts that gained likes while losing followers, is the more common failure mode and the less discussed one. Those accounts are still reaching people and still earning engagement on what they publish, but they are shedding their existing audience faster than they convert new viewers. They also start larger than average, at a median 9,536 followers against 4,122 for the accounts that grew on both measures.
Does verification make a TikTok account grow faster?
No, and the raw comparison that suggests otherwise is entirely a size effect. Across our measured cohort, unverified accounts grew at a median 3.57 percent and verified accounts at a median 0.09 percent, which looks like a damning result for verification until you notice that the median verified account in the cohort had 6,100,000 followers and the median unverified account had 5,698. Verified accounts are roughly 1,070 times larger, and larger accounts grow more slowly in percentage terms for reasons that have nothing to do with a badge.
Controlling for size, the picture is that verification makes no positive difference to growth rate. Inside the 100,000 to 999,999 follower band, where the measurement is fine enough to trust, 105 verified accounts grew at a median 0.930 percent while 1,270 unverified accounts of the same size grew at a median 1.467 percent. We also measured a verified group below 100,000 followers, but it contained only 25 accounts, which is below our minimum group size, so we are not quoting it.
Verification on TikTok is best understood as a marker of what an account already is rather than a lever that changes what it becomes. In our index of 12,538 accounts, the verified share climbs from 0.22 percent of accounts under 1,000 followers to 9.59 percent at 10,000 to 99,999, 23.82 percent at 100,000 to 999,999, 65.64 percent at 1,000,000 to 9,999,999 and 93.59 percent above 10,000,000. It arrives with scale; it does not appear to create it. If you are pricing an account, our published analysis of what verification is actually worth when you buy an account covers what the badge does and does not survive.
A bio link shows the same confounded pattern and deserves the same caution. Among 8,114 sub-million accounts, those with a link in the bio were more likely to grow, 78.14 percent against 69.09 percent, but grew more slowly at the median, 2.94 percent against 4.05 percent. Accounts with a bio link had a median 48,050 followers against 1,669 for accounts without one, 28.8 times the size, and 386 lifetime videos against 69. Accounts with a bio link also tend to be older, larger and more deliberately operated; the link is a symptom of that, not a cause of the growth.
What does a normal TikTok account look like?
The median account in our TikTok index has 10,500 followers, follows 63 accounts, has posted 164 videos and has collected 286,750 lifetime hearts. That profile comes from 12,538 accounts captured at 2026-08-27 01:23 UTC, which together hold 15,014,690,893 followers, 540,432,207,714 hearts and 7,540,818 videos. The follower total counts overlapping audiences many times over and is not a count of unique people.
| Follower band | Accounts | Share of index | Verified | Has bio link | Private | Median videos | Median following |
|---|---|---|---|---|---|---|---|
| Under 1,000 | 3,129 | 24.96% | 0.22% | 3.16% | 2.88% | 21 | 33 |
| 1,000 to 9,999 | 2,986 | 23.82% | 1.81% | 26.49% | 1.00% | 95 | 81 |
| 10,000 to 99,999 | 2,929 | 23.36% | 9.59% | 43.50% | 0.41% | 252 | 51 |
| 100,000 to 999,999 | 1,935 | 15.43% | 23.82% | 63.00% | 0.26% | 610 | 78 |
| 1,000,000 to 9,999,999 | 1,138 | 9.08% | 65.64% | 71.79% | 0.70% | 1,088.5 | 129.5 |
| 10,000,000 and above | 421 | 3.36% | 93.59% | 69.60% | 0.48% | 1,297 | 174 |
Sample: n = 12,538 TikTok accounts in the PlayerSells index at 2026-08-27 01:23 UTC. Follower counts across the index run from 0 to 162,666,148, with a median of 10,500 and percentiles of 113.7 at the 10th, 1,003.5 at the 25th, 139,865.25 at the 75th, 1,717,155.8 at the 90th and 22,975,396.99 at the 99th.
The following-count column is the one most people get wrong about TikTok. The median indexed account follows 63 accounts, the 75th percentile follows 273 and the 90th follows 888.6, so the median ratio of following to followers is 0.0031, roughly one account followed for every 323 followers held. TikTok caps the number of accounts a user can follow at 10,000, which we confirmed because that is the exact maximum in our index, but only 5 accounts of 12,538 actually sit at the cap. The follow-back economy that shapes other networks is close to absent here.
Private accounts are rare in the index at 147 of 12,538, and the share is highest in the smallest band at 2.88 percent. Bio links follow the opposite curve to privacy, rising from 3.16 percent of accounts under 1,000 followers to 71.79 percent in the 1,000,000 to 9,999,999 band before easing back to 69.60 percent at the very top. That dip at the top is small and we would not read anything into it. You can browse the full indexed set at the TikTok accounts directory, and the same engine powers the other network directories collected on our insights hub.
How we measured this, and the rounding problem we found
Our TikTok engine captured 500,345 raw profile reads of 12,538 accounts between 2026-06-24 20:14 UTC and 2026-08-27 01:21 UTC, and rolled them into 179,404 end-of-day rows covering 12,504 accounts. Every follower figure, heart figure and video figure in this article was computed from those two tables directly. We did not use the pre-computed daily_growth or growth_pct columns for any published number, and the reason is in the next paragraph.
The column named daily_growth in our own schema is not a per-day figure. We validated it against 166,900 consecutive snapshot pairs and found that it matches the difference against the previous snapshot 96.03 percent of the time, where the mean gap between snapshots is 3.42 days. For an account sampled once a week, daily_growth is a weekly figure carrying a daily name. We recomputed every delta ourselves from first snapshot to last snapshot per account, which is why our cohort definition and our observed spans are stated explicitly next to every table.
The measurement window is 64 calendar days but only 48 of them contain data. Our crawler recorded snapshots on 48 distinct days between 2026-06-24 and 2026-08-26, with a 16-day gap from 2026-07-03 to 2026-07-18 inclusive when the engine was not writing daily rows. Per-account coverage is sparser still: the median account has 7 snapshot days and no account in the table has all 64. That is why we anchor growth on first and last snapshot and require a span of at least 45 days rather than pretending to a continuous daily series.
The rounding discovery is the finding we would most want another data team to reproduce. Before 2026-08-24 our index carried TikTok's public display value rather than an exact count, and the quantization is visible in the data with no ambiguity at all.
| Follower band | Snapshots before 2026-08-24 | Multiples of 100 | Multiples of 100,000 | Effective resolution |
|---|---|---|---|---|
| Under 10,000 | 30,470 | 0.91% | 0.00% | Exact |
| 10,000 to 99,999 | 14,012 | 100.00% | 0.00% | 100 followers |
| 100,000 to 999,999 | 57,502 | 100.00% | 0.19% | 100 followers |
| 1,000,000 and above | 60,476 | 100.00% | 100.00% | 100,000 followers |
Sample: n = 162,460 end-of-day snapshots with a non-zero follower value, taken between 2026-06-24 and 2026-08-23. The 0.91 percent figure in the top row is what chance alone produces, confirming that counts below 10,000 followers are exact.
That pattern maps exactly onto how TikTok displays follower counts in its own interface: 9,842 below ten thousand, 45.6K between ten thousand and a million, 4.5M above a million. We can also date the change in our own pipeline precisely. On every one of the 45 measurement days from 2026-06-24 to 2026-08-23, 100.00 percent of follower values above one million were multiples of 100,000. On 2026-08-24 that fell to 50.83 percent, and on 2026-08-25 and 2026-08-26 it was 0.00 percent.
Straddling that date manufactures growth that never happened. On the contaminated window, all 1,373 large accounts in our cohort start on a 100,000 grid and only 5 end on it, and 1,139 of them appear to move by less than the 100,000 resolution that governed their starting value. Measured that way the cohort looks like 69.07 percent grew and 24.80 percent shrank. Measured on a window where the scale never changes, the same cohort is 64.47 percent grew and 19.56 percent shrank. We publish the second pair. Every growth number in this article is restricted to snapshots taken before 2026-08-24.
The heart totals carry a separate integrity story that we verified before publishing a single likes figure. TikTok's public heartCount field overflows a signed 32-bit integer for the largest accounts and wraps around, which our engine fixed by switching to the statsV2 field. We checked whether that fix is holding: 33 accounts in the index now carry heart totals above the 2,147,483,647 ceiling, the largest is 12,316,411,148, and across 166,900 consecutive snapshot pairs there are zero drops large enough to be a wraparound. The largest single heart decrease we recorded is 47,878,990, which is a deleted video taking its likes with it, not a counter rolling over. Heart totals above one million are subject to the same 100,000-unit rounding as follower counts before 2026-08-24, and we say so wherever it matters.
What this data cannot tell you
Our TikTok index is not a random sample of TikTok, and no analysis in this article should be read as describing the platform as a whole. TikTok does not publish a directory, so our 12,538 accounts are the ones our crawler discovered and chose to keep, which skews toward accounts that are visible enough to be found. The size distribution shows the effect plainly: 3.36 percent of our index sits above ten million followers, a share that has no relationship to the real platform. Everything here describes the accounts we index.
The growth cohort is narrower still, and it is skewed by when accounts entered the index. Of the 9,559 accounts with a measurable 45-day span, 91.90 percent were first indexed in June 2026, because accounts added in the August expansion do not yet have a long enough series. The 2,979 accounts we excluded are more than twice as likely to be verified, 28.16 percent against 11.56 percent, precisely because that August expansion pulled in large verified accounts. Our growth numbers therefore under-represent recently indexed, larger, verified accounts.
We cannot measure day-to-day follower volatility for small accounts, and we would rather say that than publish a chart that pretends otherwise. Our crawler samples accounts above 100,000 followers at least six times more densely than smaller ones: an average of 36.7 snapshots for the 100,000 to 999,999 band and 42.8 for accounts above a million, against 5.6 to 5.8 for every band below 100,000. Only 15 accounts under 100,000 followers have 10 or more snapshots in the clean window. Any daily volatility analysis we ran was, in practice, an analysis of large accounts.
Where we could measure step-by-step movement, the measurement floor dominates the result and we report it as a floor. Among 1,370 densely sampled accounts between 100,000 and 999,999 followers, averaging 39.0 measurement steps each, the median account's published follower number rose on 37.84 percent of steps, fell on 4.76 percent and did not move on 42.46 percent, a rise-to-fall ratio of 7.9 to one. Among 1,317 densely sampled accounts above one million, the median account showed no change on 100.00 percent of steps, which is the 100,000-follower rounding, not stasis.
We deliberately did not publish a day-of-week growth analysis, even though the data superficially supports one, because it would have measured our own scheduler. Snapshot volume in our table varies 3.78 times across weekdays, from 54,028 rows on Mondays to 14,300 on Fridays. Any weekday growth pattern computed from that would reflect when our crawler runs rather than when TikTok users follow people. If you see a day-of-week TikTok growth chart built on scraped snapshots, ask what the sampling schedule looked like.
Three columns in our TikTok schema are structurally empty and are quoted nowhere in this article. The region column is NULL on all 12,538 rows, so we have no country data at all and used the profile language label instead, which is not the same thing: a profile in English can belong to anyone anywhere. The citation_score and out_degree columns are zero on every row of the TikTok index. Category is present on only 2,786 accounts, 22.2 percent of the index, which is why every category figure names its own sample size and every group below 30 accounts is dropped.
Finally, correlation is not causation anywhere in this article and we have tried to say so at each point rather than once at the end. Posting cadence and growth are measured across the same window, so momentum could be driving posting rather than the reverse. Lifetime video count and lifetime follower count correlate at a Spearman rank of 0.7178, but both are also proxies for account age, so that correlation is not evidence that posting more produces followers. Language groups differ in growth rate, but the language mix in our index reflects how our crawler was seeded, not TikTok's global population.
Questions about TikTok growth benchmarks
What is a normal TikTok follower growth rate in 2026?
Across 8,111 TikTok accounts under 1,000,000 followers that we measured between 2026-06-24 and 2026-08-23, the median compound growth rate was 2.09 percent per 30 days, which annualises to 28.63 percent. The 25th percentile was 0.00 percent and the 75th percentile was 12.87 percent. If your account is growing between 1 and 5 percent a month, you are close to the middle of our measured distribution rather than behind it.
Do most TikTok accounts grow or shrink?
Most grow. Among 9,559 TikTok accounts we measured over a median 53 days between 2026-06-24 and 2026-08-23, 64.47 percent gained followers, 19.56 percent lost followers and 15.96 percent showed no change. Restricting to accounts below 1,000,000 followers, where the measurement is finer, 71.62 percent grew and 21.04 percent shrank. That makes TikTok an exception to the pattern we found across other networks, where most indexed accounts shrink.
What is a good TikTok engagement rate?
It depends entirely on size, and any single number is an average across an order of magnitude. Measuring lifetime hearts per video as a share of current followers on 10,443 accounts, the median was 26.75 percent for accounts under 1,000 followers, 7.38 percent for 10,000 to 99,999, 4.06 percent for 100,000 to 999,999 and 2.24 percent above 1,000,000. Compare your account against its own follower band, not against a platform-wide figure.
How many videos should a TikTok account post per week?
The median account in our index posted 1.22 videos per week across the window, so anything above that is above average behaviour. Within a size-controlled group of 4,264 accounts starting between 1,000 and 99,999 followers, median growth rose from 0.00 percent for accounts posting nothing to 14.72 percent for accounts posting seven or more a week. Median likes per new video fell over the same range, from 2,233 to 547, so higher cadence buys reach and costs per-post performance.
Why does my TikTok follower count not change for days?
Above 1,000,000 followers, TikTok publishes your follower count rounded to the nearest 100,000, so the public number only moves when you gain a full hundred thousand. Between 10,000 and 999,999 followers the resolution is 100. We verified this on 162,460 snapshots taken before 2026-08-24: 100.00 percent of values above one million were exact multiples of 100,000, and 100.00 percent of values between 10,000 and 999,999 were multiples of 100.
What share of TikTok growth goes to the biggest accounts?
In our cohort of 9,559 accounts measured between 2026-06-24 and 2026-08-23, the top 1 percent by absolute gain, 96 accounts, captured 62.83 percent of all net follower growth. The top 10 percent captured 107.34 percent, which is possible only because the bottom 90 percent of accounts collectively lost 10,606,988 followers over the same window. Ten accounts alone took 32.49 percent of the net total.
Does TikTok verification help an account grow?
Our data shows no growth advantage from verification once size is held constant. Inside the 100,000 to 999,999 follower band, 105 verified accounts grew at a median 0.930 percent while 1,270 unverified accounts of the same size grew at a median 1.467 percent. Verification tracks scale rather than creating it: it appears on 0.22 percent of accounts under 1,000 followers and 93.59 percent of accounts above ten million.
How can you tell if a TikTok account has fake followers?
One measurable pattern is followers arriving without engagement. Among 8,114 accounts we measured, 315 of them, 3.88 percent, gained a median 100 followers while collecting zero new likes across roughly two months. That combination is worth investigating, but it is not proof: an account that deletes videos loses their likes and produces the same signature. Verify against a full history rather than a single ratio.
Is a TikTok account with more videos worth more?
Video count and follower count correlate strongly across our index, at a Spearman rank correlation of 0.7178 on 12,067 accounts, but both are also proxies for account age, so the correlation cannot be read as value. Within a single posting-volume band the follower spread is enormous: among accounts with 200 to 999 videos, the 25th percentile has 9,734.5 followers and the 75th has 286,304.5. Price the audience and the engagement, not the upload count.
What to do with these numbers
Start by placing your own TikTok account on the percentile ladder rather than against an average, because the average in our data describes 3.14 percent of accounts. Take your follower count 30 days ago and today, compute the percentage change, and read it against the table in the second section of this article: 2.09 percent is the median, 9.43 percent is the 70th percentile, 49.09 percent is the 90th. The percentile rank tool linked earlier in this article does that size comparison against the live index, and the follower growth simulator lets you project a measured rate forward instead of guessing at one.
If your account sits below the median, the single measured lever with the clearest dose-response in our data is posting cadence, with the causal caveat we stated above. Within a fixed size band, accounts posting seven or more videos a week grew at a median 14.72 percent against 0.00 percent for accounts posting nothing, and 93.36 percent of them grew at all. Expect fewer likes per individual video as cadence rises: the median falls from 2,233 to 547 across that range.
If you are valuing an account rather than growing one, the numbers here are inputs rather than answers. What a TikTok account sells for depends on the audience, the niche and the transfer risk, which we cover in our published work on what actually drives TikTok account prices and on TikTok transfer rules and real risks. Our TikTok earnings calculator gives you a revenue estimate from the same engagement inputs used in this article.
For the cross-platform view, the two companion pieces are the analysis of six million daily snapshots showing most social accounts shrinking, which TikTok contradicts, and the follower count benchmarks drawn from 17 million X accounts. If you decide to buy or sell rather than grow, the PlayerSells marketplace and the escrow process are the practical next steps.
We will re-run every query in this article as the index grows and the observation window lengthens. The numbers above are dated to a 64-day window ending 2026-08-26 and an index snapshot at 2026-08-27 01:23 UTC, and we have stated the cohort, the sample size and the measurement resolution beside every table so that the work can be checked rather than trusted.
Free tools for this topic

Published by the PlayerSells editorial team. Data comes from PlayerSells marketplace records and our own crawlers. About PlayerSells · Editorial policy
Related Articles
Continue learning with these related guides.
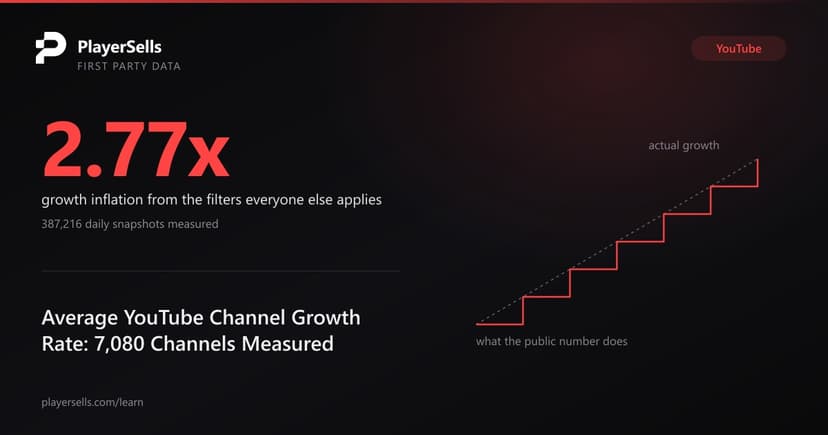
Average YouTube Channel Growth Rate: 7,080 Channels Measured
We measured the average YouTube channel growth rate across 7,080 tracked channels: a median of 0.168 percent per 30 days, and 28.49 percent flat.

LinkedIn Company Page Benchmarks From 29,742 Real Pages
We measured 29,742 LinkedIn company pages. The median engagement rate is 0.1685 percent of followers, not the 2 percent that benchmark posts quote.
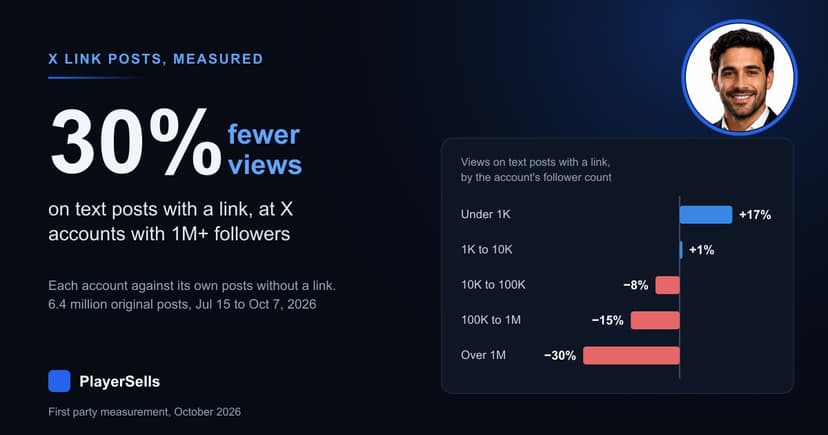
Does X Still Penalize Links? 6.4 Million Posts Measured
Across 6.4 million X posts, text posts with a link drew 10% fewer views than the same account's posts without one, and 30% fewer at 1M+ followers.