
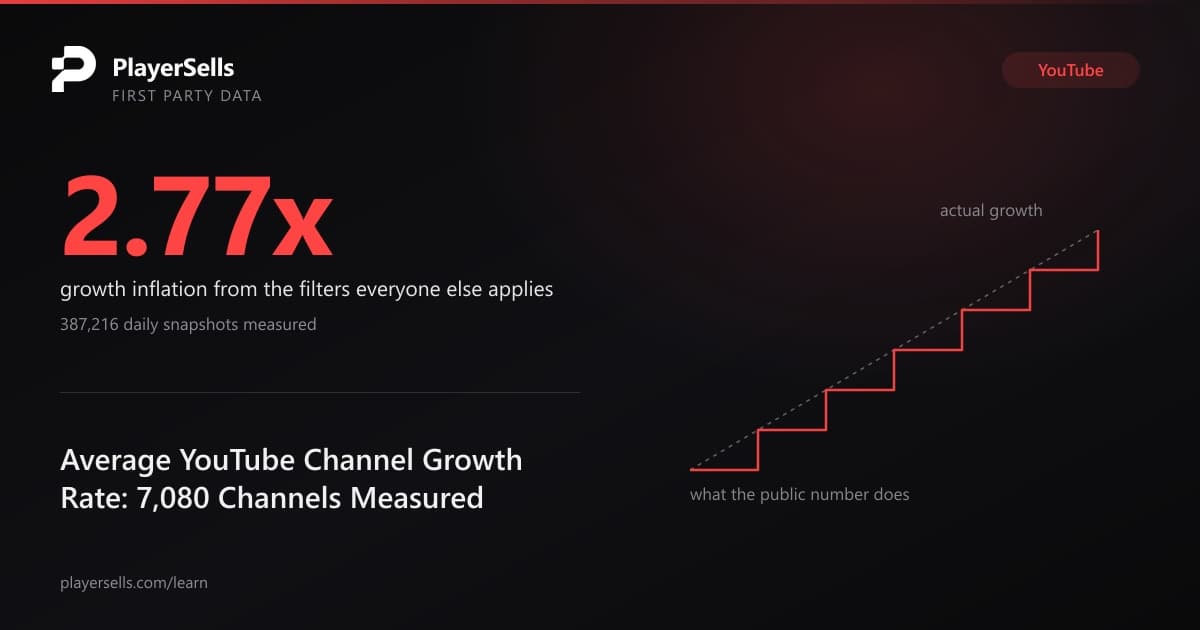
Average YouTube Channel Growth Rate: 7,080 Channels Measured
We measured the average YouTube channel growth rate across 7,080 tracked channels: a median of 0.168 percent per 30 days, and 28.49 percent flat.
Across 387,216 end-of-day channel snapshots we recorded between 2026-06-10 and 2026-08-28, the most consequential fact about YouTube growth data turned out not to be a growth rate at all. YouTube rounds every public subscriber count down to three significant figures, and we measured exactly what that does to the numbers everyone benchmarks against: in 363,266 day-over-day pairs, 92.45 percent showed no subscriber change whatsoever. For channels between 1,000,000 and 10,000,000 subscribers the figure is 96.22 percent, and on the days the number does move, the median move is exactly 10,000. A daily YouTube subscriber chart is mostly a chart of a rounding boundary being crossed.
The average YouTube channel growth rate, as it circulates in 2026, is also a survivor's number. The two publishers who hold YouTube growth data at genuine scale both disclose in their own methodology notes that they remove the channels that stopped before they report anything. Our engine removes nothing. Across the 7,080 channels we tracked densely enough to measure a rate, the median channel gained 0.168 percent per 30 days, 28.49 percent showed no movement at all, and 11.92 percent went backwards. We then applied a survivorship filter to our own data, and our own median more than doubled without a single channel changing behaviour.
One naming rule governs everything below. The median channel in our YouTube index carries 62,000 subscribers, and the median channel in the densely tracked cohort carries 1,510,000. Neither number is YouTube's median. Both describe the channels our crawler chose to index and then chose to track daily, which skews hard toward large, established, already discoverable channels. Read every figure in this article as the median tracked channel in our index, never as the average YouTube channel.
What is the average YouTube channel growth rate in our index?
The average YouTube channel growth rate in our fully measured cohort is 0.381 percent per 30 days as a mean and 0.168 percent as a median, across n = 7,080 channels observed for a mean of 65.6 days each. In absolute subscribers the median tracked channel added 2,400 per 30 days against a mean of 12,379.8. The mean sits 5.16 times above the median, and only 30.88 percent of the cohort reached or exceeded the mean. Any single number labelled "average" for YouTube growth therefore describes a minority of channels, and the direction of the error is always upward.
The percentile spread matters more than either summary statistic. In the cohort of 7,080 channels the 25th percentile of 30-day subscriber growth is exactly 0.000 percent, the 75th percentile is 0.465 percent, and the 99th percentile is 3.547 percent. A quarter of large tracked channels did not register a single subscriber change over a window averaging more than two months. The top one percent of channels captured 32.54 percent of every subscriber gained across the whole cohort. Growth on YouTube, measured this way, is not a rate that most channels have a version of. Growth is an event that happens to a small minority.
| Percentile of 30-day subscriber growth | Growth rate | What it means |
|---|---|---|
| 1st | -0.306% | Losing subscribers at a measurable clip |
| 10th | -0.061% | Slightly negative |
| 25th | 0.000% | No detectable movement at all |
| 50th (median) | 0.168% | The typical tracked channel |
| Mean | 0.381% | Reached by only 30.88% of the cohort |
| 75th | 0.465% | Upper quartile |
| 90th | 0.984% | One percent a month is the 90th percentile |
| 95th | 1.575% | Top twentieth |
| 99th | 3.547% | Top hundredth |
Sample: n = 7,080 channels with at least 6 daily snapshots and a first-to-last span of at least 45 days, drawn from 387,216 snapshots recorded 2026-06-10 to 2026-08-28. Growth is computed from each channel's first and last stored subscriber count, divided by that channel's own observed span, then scaled to 30 days. Medians use percentile_cont, never an average of averages. Our percentile tool at the YouTube subscriber percentile rank checker covers channel size for this same index, and this article covers rate of change only.
Why is every published YouTube growth number a survivor's number?
Every widely circulated YouTube growth benchmark rests on a filter that removes non-growing channels, and the publishers say so plainly in their own methodology notes. One widely used YouTube analytics vendor, vidIQ, published a July 2026 distribution study across 61,186,246 unique channels holding at least one public subscriber. Its growth figures, though, come from a much smaller slice: 11,752,034 channels that had at least one subscriber at the start of a trailing 90-day window and a net increase in public video count during that window. A channel that stopped uploading is not in that growth sample. The vendor is transparent about the choice, and to its credit it also states that channels with subscriber declines remained in the sample it did keep.
A second vendor, publishing a monthly growth table by channel size and by niche, states the filter even more directly. Its methodology note reads: "Averages describe typical active channels, meaning channels that upload at least weekly. The millions of dormant channels would drag every number toward zero and tell you nothing." That sentence is correct about the mechanism and wrong about the conclusion. Dormant channels dragging the number toward zero is not noise contaminating a signal. Dormant channels dragging the number toward zero is the signal, if the question you are asking is what a channel typically does rather than what a channel that is still trying typically does.
Both questions are legitimate and they have very different answers. A creator asking how fast a channel should grow while uploading every week wants the filtered number. A buyer valuing a channel on an account marketplace, or an operator deciding whether a portfolio is appreciating, wants the unfiltered one, because a bought channel does not come with a guarantee that anyone will keep uploading. Our engine publishes the unfiltered number because nobody else does, and later in this article we quantify the exact gap between the two by running the vendors' filter over our own data.
Which channels did we actually measure, and how did we define the cohort?
Our YouTube index contains 35,149 channels, of which 20,681 receive daily snapshots, and the difference between those two groups is the first thing a reader deserves to see. The 20,681 tracked channels carry a median of 272,000 subscribers. The 14,468 channels we hold but do not track daily carry a median of 13,600. Our crawler tracks big channels densely and small channels barely, so the tracked panel is roughly 20 times larger at the median than the untracked remainder of the same index. Any growth rate we publish describes large channels, and pretending otherwise would be the exact error this article exists to correct.
Coverage inside the tracked group is also lopsided. The mean channel has 18.7 snapshots, but the median channel has 4, and the median first-to-last span is 17 days. Only 14,765 of 20,681 tracked channels have more than one snapshot at all, and only 4,645 span 60 days or more. Reporting a growth rate from a channel observed twice, nine days apart, would be arithmetic rather than measurement. We therefore defined a fully measured cohort in advance and report its n beside every growth figure in this article.
| Subscribers at first observation | Channels tracked | Median snapshots per channel | In the dense cohort |
|---|---|---|---|
| Under 10,000 | 3,233 | 1 | 0 |
| 10,000 to 100,000 | 4,420 | 1 | 0 |
| 100,000 to 500,000 | 5,488 | 4 | 0 |
| 500,000 to 1,000,000 | 2,672 | 10 | 125 |
| 1,000,000 to 5,000,000 | 3,740 | 59 | 2,203 |
| 5,000,000 and above | 1,128 | 64 | 700 |
Sample: all n = 20,681 channels with at least one daily snapshot, out of 35,149 channels in our YouTube index. The dense cohort column requires at least 30 snapshots and a span of at least 60 days, which yields 3,028 channels and 195,259 snapshots. No channel under 500,000 subscribers clears that bar, which is why the primary cohort used throughout this article is looser: at least 6 snapshots and a span of at least 45 days, giving n = 7,080 channels and 334,214 snapshots. Both cohorts agree closely. The dense cohort's median 30-day growth is 0.205 percent against 0.168 percent for the primary cohort, and its direction split is 61.16 percent up, 31.70 percent flat and 7.13 percent down, against 59.59, 28.49 and 11.92.
Our crawl was not perfectly continuous either. The window from 2026-06-10 to 2026-08-28 contains 80 calendar days but only 78 crawl days, because we captured nothing at all on 2026-06-29 or 2026-06-30. Daily snapshot volume also rose across the window, from 3,103 rows a day in mid-June to 5,337 on the final day, as the tracker expanded. That expansion is why so many channels have a short observed span, and it is a second reason we compute every rate against each channel's own span rather than against a fixed calendar window.
Why does YouTube's own subscriber number make daily growth unmeasurable?
YouTube's public subscriber count is rounded down to three significant figures, and that single design choice destroys most of the resolution daily growth tracking appears to offer. Google states the behaviour in its own API reference for the channels resource, where the subscriber count field is documented as rounded down to three significant figures. We did not take that on trust. Across all 387,216 snapshots we recorded, we tested divisibility band by band, and the rounding ladder falls out of the data with no ambiguity at all.
| Subscriber band | Snapshots | Channels | Divisible by the band step | Divisible by the next step up | Effective step size |
|---|---|---|---|---|---|
| Under 1,000 | 1,161 | 766 | 11.20% (by 10) | 1.03% | 1 (exact) |
| 1,000 to 9,999 | 3,793 | 2,474 | 100.00% (by 10) | 9.31% | 10 |
| 10,000 to 99,999 | 7,300 | 4,431 | 100.00% (by 100) | 9.48% | 100 |
| 100,000 to 999,999 | 76,097 | 8,168 | 100.00% (by 1,000) | 10.26% | 1,000 |
| 1,000,000 to 9,999,999 | 268,100 | 4,436 | 100.00% (by 10,000) | 10.22% | 10,000 |
| 10,000,000 to 99,999,999 | 30,275 | 457 | 100.00% (by 100,000) | 11.07% | 100,000 |
| 100,000,000 and above | 490 | 7 | 100.00% (by 1,000,000) | not applicable | 1,000,000 |
Sample: all 387,216 snapshots across n = 20,681 channels, 2026-06-10 to 2026-08-28. Read the table as a proof rather than a description. In every band above 1,000 subscribers, 100 percent of values are divisible by the step, while divisibility by the next step up sits at roughly 10 percent, exactly the rate you would expect from values scattered uniformly across a quantized grid. The bottom row covers only 7 channels and is underpowered, though it is consistent with the ladder. Below 1,000 subscribers the counts are exact, and the 11.20 percent divisible by 10 is simple chance.
The practical consequence is that a large channel's subscriber count physically cannot move by less than its step. A channel sitting at 2,200,000 subscribers reports in increments of 10,000, so it can gain 9,999 real subscribers and report zero. We measured how often that happens. Across 363,266 day-over-day pairs where a previous snapshot existed, 92.45 percent registered no change, and the share climbs in lockstep with the step size.
| Subscriber band | Day-over-day pairs | Pairs showing no change | Share showing no change | Median move when it does move |
|---|---|---|---|---|
| Under 100,000 | 4,601 | 2,083 | 45.27% | 100 |
| 100,000 to 999,999 | 64,668 | 53,546 | 82.80% | 1,000 |
| 1,000,000 to 9,999,999 | 263,695 | 253,738 | 96.22% | 10,000 |
| 10,000,000 and above | 30,302 | 29,510 | 97.39% | 100,000 |
Sample: n = 363,266 day-over-day pairs across 20,681 channels, being every snapshot in the window that has a prior stored snapshot for the same channel. The median move, on the days a channel moves at all, is exactly the rounding step for its band in all four rows. No underlying subscriber behaviour produces that pattern. Only rounding does. Anyone publishing a daily YouTube subscriber gain for a channel above one million subscribers, from public data, is publishing the timing of rounding events rather than the arrival of subscribers.
View counts escape the problem entirely, which is what makes them so useful in the sections that follow. Of the 387,216 view totals we captured, only 10.50 percent are divisible by 10, precisely the share chance predicts. YouTube publishes lifetime channel views exactly, to the unit. Every claim in this article that needs fine resolution is therefore built on views, and every claim built on subscribers is stated with its resolution attached.
What percentage of YouTube channels are shrinking?
Among the large channels we can measure most precisely, 17.82 percent lost subscribers over a median observed window of roughly two months. Reaching that number required separating real stagnation from the rounding artifact, and the separation is straightforward once you notice that a channel's measurement resolution depends on where it sits inside its decade rather than on how big it is. A channel at 9,500,000 subscribers reports in steps of 10,000, which is 0.11 percent of its size. A channel at 1,050,000 reports in the same 10,000 steps, which is 0.95 percent of its size. The smaller channel is measured nine times more coarsely than the larger one.
We split the cohort of 7,080 channels into three resolution classes by that ratio and compared them. If coarse measurement inflates the flat share, the flat share should rise as the ruler gets cruder while the underlying behaviour stays constant. Our exact view data provides the control, because view velocity per existing subscriber is measured to the unit and is untouched by subscriber rounding.
| Measurement resolution | Channels | Median size | Median step as share of size | Gained subs | No change | Lost subs | Views per subscriber per 30 days |
|---|---|---|---|---|---|---|---|
| Fine (step 0.25% of size or less) | 3,215 | 842,000 | 0.150% | 68.55% | 13.62% | 17.82% | 1.83 |
| Medium (step 0.25% to 0.50%) | 1,435 | 2,750,000 | 0.372% | 57.98% | 32.75% | 9.27% | 2.06 |
| Coarse (step above 0.50% of size) | 2,430 | 1,450,000 | 0.730% | 48.68% | 45.64% | 5.68% | 1.62 |
Sample: n = 7,080 channels, at least 6 snapshots each and a span of at least 45 days, from 334,214 snapshots. The flat share more than triples as resolution coarsens, from 13.62 percent to 45.64 percent, and the share recorded as shrinking collapses from 17.82 percent to 5.68 percent. Median exactly measured view velocity barely moves across the three classes, at 1.83, 2.06 and 1.62 views per existing subscriber per 30 days. The three classes are not three different populations of channel. The three classes are the same population measured with rulers of different coarseness, and the coarse ruler converts shrinking channels into flat ones.
Our best estimate for the share of large tracked channels losing subscribers is therefore 17.82 percent, taken from the 3,215 channels where our resolution is finest, not the 11.92 percent that falls out of the whole cohort. Name the confound honestly: the fine-resolution class has a lower median size, 842,000, than the coarse class at 1,450,000, so size and resolution are partly entangled. What breaks the entanglement is the medium class, whose median size of 2,750,000 is the largest of the three while its flat share sits in the middle. Resolution orders the flat share, and size does not.
Do bigger YouTube channels grow faster or slower than small ones?
Bigger channels in our cohort add far more subscribers and grow at a similar percentage rate, which contradicts the standard advice that percentage growth falls steadily with size. Across n = 7,080 channels the median 30-day percentage gain is remarkably flat from 100,000 subscribers all the way past 10,000,000, moving only between 0.165 and 0.228 percent, while the absolute median gain rises from 968 to 45,455 subscribers per 30 days. The one dramatic exception in the table below is not a behavioural finding, and reading it as one would be an error.
| Size at first observation | Channels | Median size | Median subs per 30 days | Mean subs per 30 days | Median % per 30 days | Gained | Flat | Lost | Median views per 30 days |
|---|---|---|---|---|---|---|---|---|---|
| 100,000 to 500,000 | 295 | 471,000 | 968 | 3,077 | 0.217% | 70.8% | 13.6% | 15.6% | 882,533 |
| 500,000 to 1,000,000 | 1,917 | 763,000 | 1,200 | 3,232 | 0.167% | 66.4% | 12.0% | 21.6% | 1,219,711 |
| 1,000,000 to 2,000,000 | 2,119 | 1,380,000 | 0 | 5,157 | 0.000% | 48.4% | 45.5% | 6.0% | 2,102,367 |
| 2,000,000 to 5,000,000 | 1,621 | 2,890,000 | 4,545 | 10,301 | 0.165% | 59.7% | 30.5% | 9.9% | 5,851,435 |
| 5,000,000 to 10,000,000 | 665 | 6,640,000 | 10,345 | 19,373 | 0.170% | 71.7% | 15.5% | 12.8% | 14,569,158 |
| 10,000,000 and above | 463 | 15,300,000 | 45,455 | 86,470 | 0.228% | 57.7% | 40.0% | 2.4% | 52,710,434 |
Sample: n = 7,080 channels from 334,214 snapshots recorded 2026-06-10 to 2026-08-28. The 1,000,000 to 2,000,000 row shows a median gain of exactly zero and a flat share of 45.5 percent, which is the rounding ladder reappearing inside a size table. Channels just above one million report in 10,000 steps, roughly 0.72 percent of a 1,380,000-subscriber channel, while a typical 30-day gain in that band is around 0.17 percent. The median channel in that row cannot move its reported number in two months even while growing normally. The 500,000 to 1,000,000 row directly above it, measured in 1,000 steps, records 21.6 percent of channels shrinking.
The absolute figures in the same table are the ones that survive rounding cleanly, because a 45,455 subscriber gain at 10,000,000 subscribers is many steps wide. Large channels add subscribers in volumes small channels never see, at a percentage rate that is not obviously different. For anyone pricing a channel, the absolute column is also the one that matters, and our YouTube channel valuation analysis of 35,149 channels covers what those subscribers are worth as a cross-section rather than as a rate.
How much does a survivorship filter inflate the average YouTube channel growth rate?
A survivorship filter of the kind the incumbent publishers describe inflates our own median growth figure by 2.77 times, and we established that by running their filter over our own data rather than by arguing about theirs. The unfiltered median across n = 7,080 channels is 0.168 percent per 30 days. Drop every channel that did not gain subscribers, which is the closest analogue to requiring a net increase in public video count, and the median jumps to 0.395 percent. Drop the bottom half by exactly measured view velocity, an active-channels-only filter, and the median lands at 0.402 percent. Apply both and the published number becomes 0.466 percent.
| Filter applied to our own cohort | Channels remaining | Median % per 30 days | Mean % per 30 days | Inflation vs unfiltered median |
|---|---|---|---|---|
| None: every channel we tracked | 7,080 | 0.168% | 0.381% | 1.00x |
| Drop channels that did not gain subscribers | 4,219 | 0.395% | 0.668% | 2.35x |
| Drop the bottom half by view velocity | 3,540 | 0.402% | 0.675% | 2.39x |
| Both filters together | 3,061 | 0.466% | 0.783% | 2.77x |
Sample: n = 7,080 channels, all four rows drawn from the same 334,214 snapshots and differing only in which channels are retained. Nothing about any channel changed between rows. Only the denominator changed. A publisher who applies the second and third filters and reports 0.466 percent has not lied about anything, and has produced a number 2.77 times the size of the number describing the same channels without a filter. That multiplier is the honest gap between "how fast do active channels grow" and "how fast do channels grow".
Circulating benchmarks sit further out still. One vendor's published table calls 1 to 2 percent a month typical for channels above 500,000 subscribers, and 2.5 percent strong. In our measured cohort of 7,080 large channels, only 688 channels (9.72 percent) reached 1.0 percent per 30 days, 232 (3.28 percent) reached 2.0 percent, and 148 (2.09 percent) reached 2.5 percent. The populations differ, and we say so plainly: their table describes channels that upload at least weekly, while ours describes every large channel our crawler tracks whether it uploads or not. The distance between the two is precisely what the filter buys.
Who captures the growth across 7,080 measured channels?
Growth in our cohort is concentrated to a degree that makes the average close to meaningless: the top 1 percent of channels captured 32.54 percent of all subscribers gained, and the top 10 percent captured 71.03 percent. Across n = 7,080 channels the cohort added a net 87,648,913 subscribers per 30 days, with 90,306,029 gained gross by the channels that grew and the difference lost by the channels that shrank. The single fastest-growing channel in the cohort was adding 4,137,931 subscribers per 30 days on its own.
Exactly measured view data shows the same shape, which is the reassuring part. The top 1 percent of channels by view gain captured 30.40 percent of all views added, and the top 10 percent captured 71.18 percent. Two metrics with completely different measurement properties, one rounded to three significant figures and one exact to the unit, produce concentration curves within 0.2 percentage points of each other at the decile. Concentration is therefore a property of YouTube distribution, not an artifact of how subscriber counts are published.
Concentration is also why the mean is the wrong statistic to quote, and why we lead with the median everywhere in this article. Our earlier measurement of a different platform, in the TikTok growth benchmarks built on 179,404 daily snapshots, found the same structure with a different metric and a different crawler. If you want to model a trajectory against a distribution rather than against a single number, the follower growth simulator lets you set a rate and see where it lands.
Does channel vintage still predict growth?
Channel vintage predicts growth rate strongly and monotonically in our cohort, with newer channels growing several times faster than older ones at broadly similar size. Across n = 7,080 channels carrying a publication date, channels created between 2005 and 2009 posted a median 0.109 percent per 30 days, channels from 2010 to 2013 posted exactly 0.000 percent, and channels created from 2022 onward posted 1.061 percent. The share going backwards falls from 15.8 percent for the 2010 to 2013 cohort to 5.6 percent for the 2022 onward cohort. Exactly measured view velocity moves the same way, from 0.98 views per subscriber per 30 days to 9.24.
| Channel created | Channels | Median size | Median % per 30 days | Mean % per 30 days | Gained | Flat | Lost | Views per subscriber per 30 days |
|---|---|---|---|---|---|---|---|---|
| 2005 to 2009 | 1,481 | 1,740,000 | 0.109% | 0.299% | 55.9% | 33.7% | 10.4% | 1.24 |
| 2010 to 2013 | 1,947 | 1,620,000 | 0.000% | 0.221% | 47.6% | 36.6% | 15.8% | 0.98 |
| 2014 to 2017 | 2,130 | 1,540,000 | 0.168% | 0.314% | 60.5% | 27.5% | 12.0% | 1.95 |
| 2018 to 2021 | 1,181 | 1,260,000 | 0.352% | 0.559% | 74.4% | 16.5% | 9.1% | 3.68 |
| 2022 to 2026 | 341 | 955,000 | 1.061% | 1.446% | 87.1% | 7.3% | 5.6% | 9.24 |
Sample: n = 7,080 channels from 334,214 snapshots, joined to a publication date our index holds for 100 percent of its 35,149 channels. The final row merges 2022 to 2024 (332 channels) with 2025 to 2026 (9 channels), because the 2025 to 2026 group alone is far below any usable threshold and we will not publish a nine-channel rate as a benchmark. Two confounds are unavoidable and we name both. Newer channels in the cohort are smaller at the median, 955,000 against 1,740,000 for the oldest group, so vintage and size are partly entangled. More importantly, a channel created in 2023 that already holds close to a million subscribers passed a far harsher survival filter than a channel that reached the same size across eighteen years, so the newest row is a selected group of recent winners.
The correlation is real and the causal reading is not available from this data. Channels created recently that reached our index also tend to grow faster, and snapshots alone cannot say whether recency causes anything. What the table does support is a practical point for anyone buying: a 2010-vintage channel with 1,600,000 subscribers and a 2023-vintage channel with 955,000 are not the same asset, and our data says the older one is roughly five times more likely to record no movement at all, at 36.6 percent flat against 7.3 percent. Transfer mechanics differ too, and our guide to buying or selling a YouTube channel covers what survives a handover.
Which YouTube categories are still growing?
Category separates growing channels from stalled ones more sharply than size does in our cohort, with sports channels posting a median 0.491 percent per 30 days against exactly 0.000 percent for business, design and gaming. Across n = 3,995 channels carrying a category label, the spread between the fastest and slowest category median is wider than the spread across the entire size range from 100,000 to 10,000,000 subscribers. Median channel size is roughly constant across categories, between 1,230,000 and 1,820,000, so the comparison is not smuggling in a size effect.
| Category | Channels | Median size | Median % per 30 days | Mean % per 30 days | Gained | Lost | Views per subscriber per 30 days |
|---|---|---|---|---|---|---|---|
| Sports | 118 | 1,465,000 | 0.491% | 0.888% | 78.8% | 8.5% | 6.25 |
| Politics | 295 | 1,460,000 | 0.268% | 0.485% | 66.1% | 6.1% | 2.06 |
| Movies | 494 | 1,465,000 | 0.258% | 0.481% | 66.8% | 9.1% | 2.43 |
| Science | 125 | 1,390,000 | 0.257% | 0.536% | 72.8% | 8.8% | 0.97 |
| Programming | 41 | 1,230,000 | 0.248% | 0.620% | 63.4% | 7.3% | 1.84 |
| Music | 771 | 1,820,000 | 0.215% | 0.380% | 63.0% | 8.9% | 3.58 |
| News | 492 | 1,350,000 | 0.208% | 0.346% | 62.6% | 12.2% | 2.44 |
| Health | 55 | 1,330,000 | 0.208% | 0.312% | 61.8% | 9.1% | 0.76 |
| Memes | 176 | 1,680,000 | 0.175% | 0.447% | 61.4% | 9.1% | 1.80 |
| Education | 583 | 1,600,000 | 0.172% | 0.436% | 62.3% | 11.5% | 1.42 |
| Tech | 148 | 1,670,000 | 0.151% | 0.265% | 56.1% | 12.2% | 1.11 |
| Crypto | 65 | 1,350,000 | 0.108% | 0.325% | 53.8% | 16.9% | 1.08 |
| Gaming | 327 | 1,470,000 | 0.000% | 0.213% | 44.3% | 19.9% | 0.93 |
| Design | 44 | 1,255,000 | 0.000% | 0.235% | 43.2% | 18.2% | 0.65 |
| Business | 261 | 1,440,000 | 0.000% | 0.247% | 42.1% | 21.5% | 0.52 |
Sample: n = 3,995 channels, being the 56.4 percent of the 7,080-channel cohort carrying a category label in our index, measured from 334,214 snapshots. Categories with fewer than 30 channels are excluded entirely rather than shown with a caveat. The taxonomy is our crawler's own classification and not YouTube's, and category is filled for only 50.2 percent of the 35,149 channels in the index, so labelled channels may differ systematically from unlabelled ones. Read the ordering, not the third decimal place.
The contrast with circulating niche benchmarks is stark and instructive. One published niche table gives gaming an average 5.5 percent monthly growth and calls it the second-fastest category on the platform. In our measurement of 327 gaming channels with a median size of 1,470,000 subscribers, the median gaming channel grew 0.000 percent over roughly two months, 44.3 percent gained subscribers and 19.9 percent lost them. Both numbers can be defensible descriptions of different populations. Gaming channels that upload weekly may well average 5.5 percent. Gaming channels in general, at this size, do not.
How long does a large YouTube channel take to double?
At the median measured rate a large tracked channel would need 413.6 months to double its subscriber count, which is 34.5 years. The arithmetic is simply the median 30-day rate of 0.168 percent compounded across n = 7,080 channels, and the point of stating it is not to forecast anything. Nobody should extrapolate a 65-day observation across three decades. The point is to show what a median growth rate of 0.168 percent per 30 days actually implies, because the same figure written as a percentage looks unremarkable and is easy to skim past.
| Channel at this percentile of growth | Rate per 30 days | Months implied to add 10% | Months implied to double |
|---|---|---|---|
| 50th (median) | 0.168% | 56.9 | 413.6 |
| 75th | 0.465% | 20.6 | 149.4 |
| 90th | 0.984% | 9.7 | 70.8 |
| 99th | 3.547% | 2.7 | 19.9 |
Sample: n = 7,080 channels from 334,214 snapshots, with each row compounding that percentile's own measured 30-day rate. Circulating niche tables put months to double between roughly 12 and 23 depending on category. In our cohort only the 99th percentile of large channels reaches a doubling time under 20 months. Those tables are not describing our population, and a reader benchmarking a real 1,500,000-subscriber channel against a 12-month doubling figure will conclude the channel is failing when it is performing at the median or above.
The honest reframe for a large channel is that percentage doubling is the wrong target and absolute additions are the right one. A channel at 5,000,000 subscribers growing at the cohort median adds roughly 10,345 subscribers per 30 days by our measurement of the 5,000,000 to 10,000,000 band. Whether that pays depends on views rather than subscribers, and the YouTube earnings calculator works from view volume for exactly that reason.
What do views tell you that subscribers cannot?
View data separates genuinely stalled channels from channels that merely look stalled through YouTube's rounding, and it does so decisively. We split n = 7,080 channels by their subscriber direction and then measured how many views each group added per existing subscriber over 30 days. Channels whose rounded subscriber count rose added a median 3.88 views per subscriber. Channels that stayed flat added 0.53. Channels whose count fell added 0.14. The subscriber direction, coarse as it is, tracks a 27-fold difference in exactly measured audience activity.
| Subscriber direction over the window | Channels | Median size | Share that still gained views | Median views added per 30 days | Views per subscriber per 30 days |
|---|---|---|---|---|---|
| Subscribers rose | 4,219 | 1,500,000 | 97.61% | 6,530,318 | 3.88 |
| No recorded change | 2,017 | 1,660,000 | 95.39% | 934,316 | 0.53 |
| Subscribers fell | 844 | 954,500 | 93.48% | 180,304 | 0.14 |
Sample: n = 7,080 channels from 334,214 snapshots, with view totals captured exactly rather than rounded. Note the confound before reading anything into the table: subscriber direction and view velocity are both downstream of whether a channel is still publishing and still being distributed, and our daily table does not store upload counts, so we cannot separate a channel that stopped uploading from one uploading into silence. What the table does establish is that the flat group is not simply the growing group hidden behind a rounding step. The flat group moves roughly seven times less audience per subscriber than the growing group, on a metric rounding cannot touch.
Across the whole cohort the median channel added 2,853,400 views per 30 days against a mean of 15,194,897, the same fivefold mean-over-median gap we measured on subscribers. A further 180 channels recorded a fall in lifetime views, which happens when videos are deleted or made private rather than when an audience leaves. For a buyer, view velocity per subscriber is the more honest health check of the two, and our YouTube channels directory surfaces it alongside size.
What share of the channels we track has actually stopped?
Among n = 7,080 large tracked channels, 22.94 percent were stalled on both metrics at once: no subscriber gain recorded and fewer than 0.50 views added per existing subscriber over 30 days. Only 69 channels (0.97 percent) were hard dormant, meaning they added exactly zero lifetime views across an observation window of at least 45 days, which for an exactly measured cumulative counter is close to proof that nothing was being watched. A further 180 channels (2.54 percent) saw their lifetime view total fall, which happens when videos are deleted or made private rather than when an audience walks away.
| Liveness test applied to the cohort | Channels | Share of cohort | Metric used |
|---|---|---|---|
| Added exactly zero lifetime views | 69 | 0.97% | Views (exact) |
| Lifetime view total fell | 180 | 2.54% | Views (exact) |
| Under 0.10 views per subscriber per 30 days | 944 | 13.33% | Views (exact) |
| Under 0.50 views per subscriber per 30 days | 1,952 | 27.57% | Views (exact) |
| No subscriber gain and under 0.50 views per subscriber | 1,624 | 22.94% | Both |
Sample: n = 7,080 channels with at least 6 snapshots and a span of at least 45 days, from 334,214 snapshots recorded 2026-06-10 to 2026-08-28. Every row except the last rests on exact view totals rather than rounded subscriber counts, which is the whole reason a liveness test built on views is worth more than one built on subscribers. A large channel can show zero subscriber movement for two months while running perfectly normally. A large channel cannot add zero lifetime views for two months while running normally.
The one figure circulating publicly on YouTube inactivity claims that of more than 600 million accounts, only about 47 million are actively contributing material, which implies roughly 92 percent inactive. That figure is attributed to an unnamed toolkit with no link to any underlying study, and our data can neither confirm nor refute it. Our crawler never sees the hundreds of millions of channels the claim is about. What we can say is bounded and checkable: within a cohort of established channels averaging over a million subscribers, roughly one in four is producing almost no measurable audience activity, which is a much higher stall rate than any published growth benchmark would lead a reader to expect for channels this size.
Stall rate also varies enormously by segment inside the same cohort. Business channels recorded 21.5 percent losing subscribers against 6.1 percent for politics, and channels created between 2010 and 2013 recorded 36.6 percent flat against 7.3 percent for channels created from 2022 onward. A single platform-wide inactivity percentage, ours included, hides more than it shows. Anyone valuing a specific channel should run the liveness tests in the table above against that channel rather than reaching for an average, and should treat a subscriber chart as the least informative of the available signals.
What this data cannot tell you
Our measurement carries four limitations a reader should weigh before using any figure above. The first and largest is selection. Our index holds 35,149 YouTube channels and tracks 20,681 daily, and both sets are the product of what our crawler chose to discover and expand. The fully measured cohort of 7,080 channels contains no channel below 100,000 subscribers, because smaller channels in our index receive a median of 1 to 4 snapshots each. Nothing in this article describes a new or small channel, and any reader with a 5,000-subscriber channel should treat these numbers as information about a different asset class entirely.
The second limitation is resolution, which we have quantified rather than hidden. Subscriber counts arrive rounded down to three significant figures, so for a channel above one million subscribers we cannot detect a change smaller than 10,000. Every subscriber-based figure in this article is therefore a floor on movement rather than a measurement of it, and the flat category always contains real growth the rounding swallowed. View totals are exact and carry no such problem, which is why the view columns do the heavy lifting wherever precision matters.
The third limitation is the window. We recorded 78 crawl days between 2026-06-10 and 2026-08-28, missing 2026-06-29 and 2026-06-30 entirely, and the mean channel in the cohort was observed for 65.6 of those days. Rates scaled from 65 days to 30 days are fine. Rates projected across years are illustrative arithmetic and nothing more. A single viral run inside the window can move a channel from the median to the 99th percentile, and our window is not long enough to say whether any individual channel's rate persists.
The fourth limitation is what our schema simply does not hold. Our daily table stores subscribers and lifetime views only, with no upload count, no watch time, no revenue and no per-video data, so we cannot attribute any growth difference to publishing cadence, format, Shorts versus long-form, or anything else a creator actually controls. Three columns in the channel table are dead and we did not use them: status reads "active" for all 35,149 rows, the hidden-subscriber flag is true for zero rows, and country is missing for 22.7 percent. Where a correlation appears above, we have named the confound rather than implying a mechanism.
How should you use these numbers?
Use the median for your size band as the benchmark, and treat the mean only as a reminder of how skewed the distribution is. A channel between 1,000,000 and 2,000,000 subscribers whose public count has not moved in two months sits exactly at the median of the 2,119 similar channels we measured, and is very likely growing at a rate its own public number physically cannot display. A channel between 500,000 and 1,000,000 that has lost subscribers is in the company of 21.6 percent of the 1,917 channels we tracked in that band, which is common rather than catastrophic.
Check view velocity per subscriber before concluding anything from a subscriber chart. Across our cohort, a channel adding fewer than roughly 0.5 views per existing subscriber per 30 days sits with the group whose subscriber count is genuinely stalled, while a channel above roughly 3.9 sits with the growing group. That single ratio is exactly measured, is immune to the rounding problem, and takes two numbers from any public channel page to compute. For a cross-platform view of the same pattern, our analysis of 6,000,000 daily snapshots across social platforms shows how far the flat-or-shrinking majority extends.
If you are buying or selling rather than growing, price the absolute additions rather than the percentage, and price the vintage. Our data says a 2010-vintage channel is roughly five times more likely to be recorded as flat than a 2022-or-later channel, and any valuation ignoring that is pricing two different assets identically. Start with our account valuation tool, and understand how escrow protects both sides before money moves. Our other measured breakdowns live on the insights hub.
Questions and answers about YouTube channel growth
What is the average YouTube channel growth rate per month?
Across n = 7,080 channels we tracked densely between 2026-06-10 and 2026-08-28, the average YouTube channel growth rate is 0.381 percent per 30 days as a mean and 0.168 percent as a median. Only 30.88 percent of channels reached the mean. Both figures describe large channels, with a median size of 1,510,000 subscribers, because our daily tracker covers no channel below 100,000 subscribers densely enough to measure. Published benchmarks in the 1 to 6 percent range describe channels filtered down to weekly uploaders.
What percentage of YouTube channels are shrinking?
Among the 3,215 channels where our measurement resolution is finest, 17.82 percent lost subscribers over a median window of roughly two months, and a further 13.62 percent showed no change. Across the full cohort of 7,080 channels the recorded figures are 11.92 percent shrinking and 28.49 percent flat, but those are depressed by YouTube's rounding, which converts small declines into apparent flatness for large channels. The 17.82 percent figure is the more defensible estimate.
Why does a subscriber count not move for days at a time?
YouTube rounds public subscriber counts down to three significant figures, so a channel above 1,000,000 subscribers reports only in increments of 10,000. We measured 363,266 day-over-day pairs and found 92.45 percent showed no change at all, rising to 96.22 percent for channels between 1,000,000 and 10,000,000. On the days a count does move, the median move equals the rounding step for that band exactly. The count is moving, and the published number is not.
Is my YouTube channel growing normally for its size?
Compare against the median for the relevant band rather than against any single average. In our cohort the median 30-day gain was 968 subscribers at 100,000 to 500,000, 1,200 at 500,000 to 1,000,000, 4,545 at 2,000,000 to 5,000,000, 10,345 at 5,000,000 to 10,000,000 and 45,455 above 10,000,000, across n = 7,080 channels. Percentage medians sat between 0.165 and 0.228 percent in every band, so a large channel is not expected to grow at a lower percentage rate than a smaller one.
Do bigger YouTube channels grow more slowly in percentage terms?
Not in our measurement. Across n = 7,080 channels the median 30-day percentage gain moved only between 0.165 and 0.228 percent, from the 100,000 to 500,000 band all the way to the 10,000,000 and above band. Absolute gains rose roughly 47-fold across that same range. The widespread claim that percentage growth falls steadily with size is not visible among channels we track above 100,000 subscribers, though it may well hold below that floor, which our data does not reach.
How long does it take a large YouTube channel to double?
At the median measured rate of 0.168 percent per 30 days, doubling implies 413.6 months, or 34.5 years. At the 90th percentile rate of 0.984 percent it implies 70.8 months, and at the 99th percentile rate of 3.547 percent it implies 19.9 months. Those figures come from compounding measured rates across n = 7,080 channels and are illustrative arithmetic rather than forecasts, since our observation window averages 65.6 days per channel.
Why do published YouTube growth benchmarks disagree with these numbers?
Published benchmarks filter out non-growing channels and say so in their own methodology. One vendor's growth sample requires a net increase in public video count during the window, which excludes any channel that stopped uploading. Another states that dormant channels would drag every number toward zero. We ran the same two filters over our own cohort of 7,080 channels and our median rose from 0.168 percent to 0.466 percent, an inflation of 2.77 times, without a single channel changing behaviour.
What is the median channel size in this dataset?
Our YouTube index contains 35,149 channels with a median of 62,000 subscribers, a 10th percentile of 1,390 and a 90th percentile of 1,530,000. The densely tracked cohort of 7,080 channels used for every growth figure here has a median of 1,510,000 subscribers. Neither figure is YouTube's median across all channels, which is far lower. Both describe channels our crawler indexed and then selected for daily tracking, which favours large and established channels.
Are YouTube view counts more reliable than subscriber counts?
Yes, by a wide margin. Of 387,216 view totals we captured, only 10.50 percent are divisible by 10, exactly what chance predicts for unrounded values, so YouTube publishes lifetime channel views to the unit. Subscriber counts arrive rounded down to three significant figures. Any metric needing fine resolution, including short-window growth, should be built on views. Views per existing subscriber per 30 days separated our growing, flat and shrinking groups by a factor of 27.
Does this data say anything about small or new YouTube channels?
No, and treating it as though it does would be the same error we are correcting. Our fully measured cohort of 7,080 channels contains no channel below 100,000 subscribers, because channels smaller than that in our index receive a median of only 1 to 4 snapshots. The median channel across our whole index of 35,149 channels is 62,000 subscribers, but those channels are not tracked densely enough for a growth rate. Every figure here describes established channels.
Free tools for this topic

Published by the PlayerSells editorial team. Data comes from PlayerSells marketplace records and our own crawlers. About PlayerSells · Editorial policy
Related Articles
Continue learning with these related guides.

How Fast Do TikTok Accounts Actually Grow? 9,559 Measured
We measured 9,559 TikTok accounts over 64 days: 64.47 percent grew, the median gained 3.63 percent, and the average overstated that by 125 times.
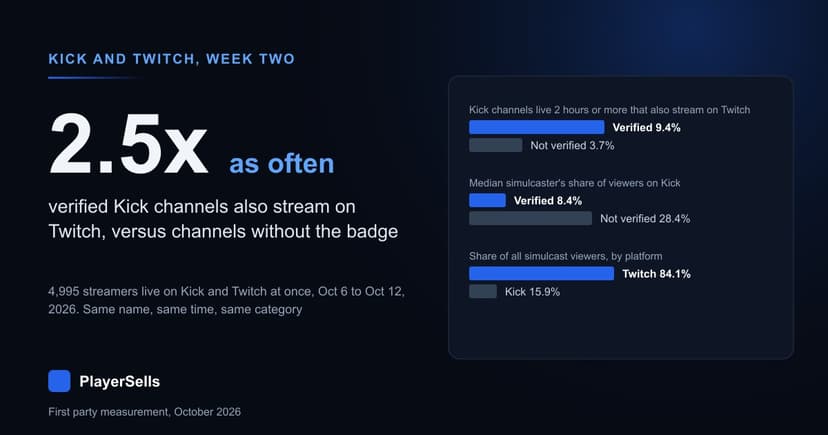
Verified Kick Channels Simulcast 2.5x as Often as Others
4,995 streamers were live on Kick and Twitch at once, Oct 6 to 12, 2026. 9.4% of verified Kick channels simulcast, against 3.7% of others.
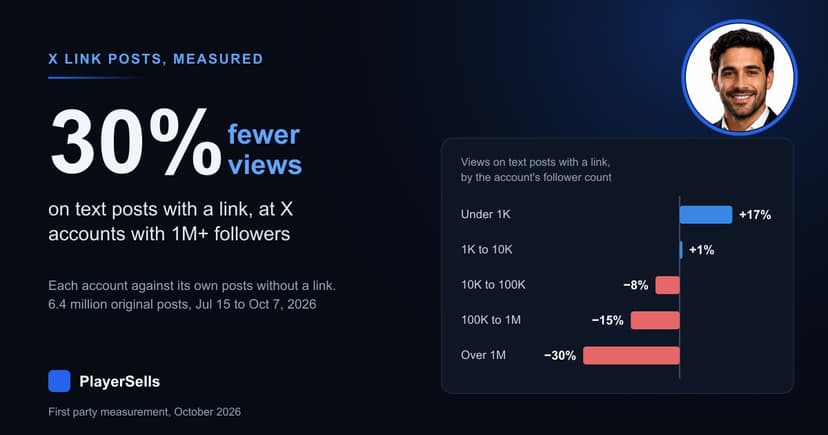
Does X Still Penalize Links? 6.4 Million Posts Measured
Across 6.4 million X posts, text posts with a link drew 10% fewer views than the same account's posts without one, and 30% fewer at 1M+ followers.