
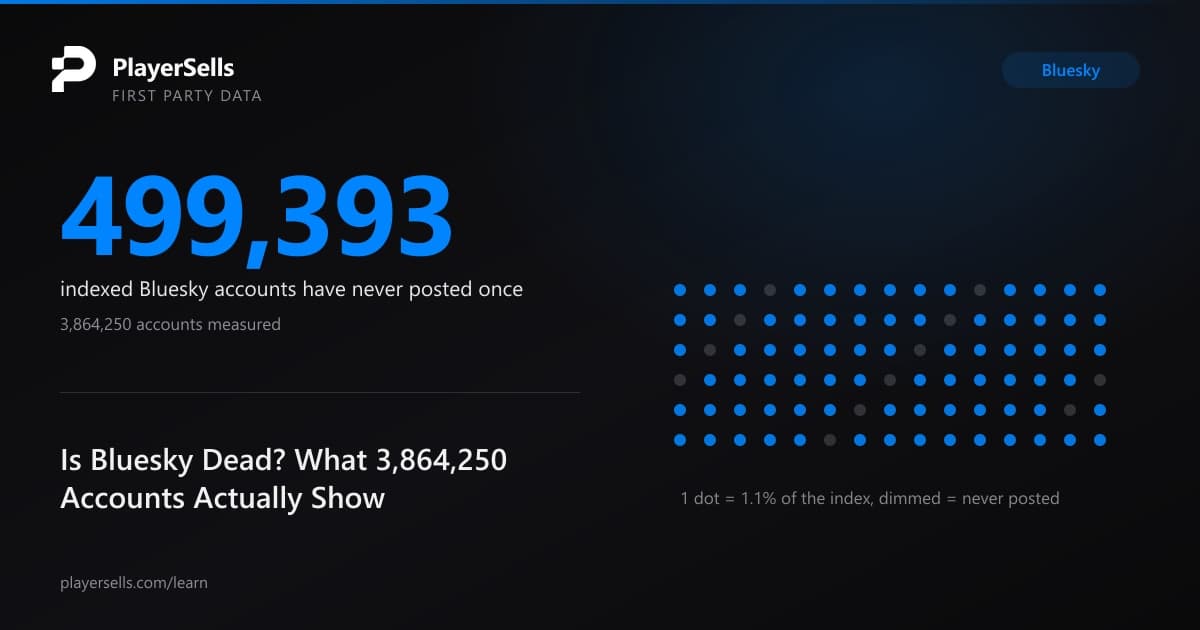
Is Bluesky Dead? What 3,864,250 Accounts Actually Show
Is Bluesky dead? We measured 3,864,250 indexed accounts: 12.9 percent have never posted, and the 29,114 we track daily grew 1.18 percent in 79 days.
We measured 3,864,250 Bluesky accounts in our own index, and 499,393 of them, 12.9 percent, have never posted once. We could not find a published source that puts any number on Bluesky dormancy. Every Bluesky figure in wide circulation during August 2026 traces back to a single Similarweb mobile-app panel, and a panel that counts phone sessions structurally cannot tell you what share of accounts are silent.
Our engine also holds 2,751,231 end-of-day snapshots across 134,498 Bluesky accounts, recorded between 2026-06-10 and 2026-08-28. That inventory answers a different question from the one the news cycle has been arguing about. The news cycle asks how many people opened the Bluesky app last month. Our tables can say how many accounts exist, how many of them ever posted, which signup cohorts went quiet, and whether the accounts we watch every single day are still gaining followers.
One caveat belongs in front of every number here, because it changes how all of them should be read. Only 134,498 of our 3,864,250 indexed accounts, 3.5 percent, receive daily tracking. Those 134,498 accounts are the top of our index by follower count, not a random slice of Bluesky. The daily-tracked cohort has a median of 6,124 followers. The rest of the index has a median of 124. Any figure in this article drawn from the tracked panel describes large Bluesky accounts and nothing else, and every one of them is labelled as such.
Is Bluesky dead, and what would actually settle the question?
Bluesky is not dead on any account-level measure we can compute, but the question "is bluesky dead" has never been tested against account data, only against app telemetry. The decline story that ran through August 2026 rests on one measurement: a Similarweb panel of mobile-app usage reporting roughly 10.4 million monthly active users in June 2026, down 27.2 percent year over year, and a fall of around 52 percent from a quarterly average near 22.1 million in the fourth quarter of 2024. Those are session numbers from phones. Nothing in them describes accounts, the web client, or the underlying protocol.
Account data answers a narrower and more durable question: of the accounts that exist, how many were ever used, and are the ones with an audience still accumulating one. We indexed 3,864,250 Bluesky accounts, which is 8.4 percent of the roughly 46 million registered users Bluesky itself reports. Inside that index, 12.9 percent have zero posts and 32.2 percent have posted fewer than ten times in their entire life. Meanwhile, in the daily panel of large accounts we track, the median account added 250 followers over 79 days and 88.5 percent of them gained followers at all. Both facts are true at once, and they describe different populations.
Reading those two results together is the whole exercise. Bluesky has a very large population of accounts that were created and never used, and a much smaller population of established accounts that are still growing, slowly. Neither of those observations refutes a session panel, and we are not claiming they do. Our existing piece on Bluesky account statistics and whether you can sell one covers the cross-section of who is on the network; this article covers who is still moving.
Why does only 3.5 percent of our index get tracked daily?
Our crawler assigns every indexed Bluesky account a priority tier, and only the top three tiers get a daily snapshot. We measured the split directly: tier S holds 11 accounts, tier A holds 944, tier B holds 34,974, and every account in those three tiers is fetched every day. Tier C holds the remaining 3,828,321 accounts, of which only 98,569, or 2.6 percent, get daily tracking. That is the entire mechanism behind the 3.5 percent figure, and it is not a sampling accident. The engine was built to watch accounts that matter to a marketplace, which means accounts with an audience.
| Crawl tier | Accounts | Tracked daily | Share tracked | Median followers |
|---|---|---|---|---|
| S | 11 | 11 | 100% | 1,343,638 |
| A | 944 | 944 | 100% | 148,960.5 |
| B | 34,974 | 34,974 | 100% | 15,944.5 |
| C | 3,828,321 | 98,569 | 2.6% | 131 |
Sample: n = 3,864,250 indexed Bluesky accounts, tier and follower count read on 2026-08-29. Medians computed with percentile_cont, not averages. Tier S is reported as measured despite holding only 11 accounts, and no percentage is derived from it.
The consequence is stark enough that it deserves a second number. Across the 134,498 daily-tracked accounts, the 5th percentile sits at 3,281 followers, the median at 6,124 and the 75th percentile at 10,537. Across the 3,729,752 accounts we do not track daily, the median is 124 followers. The daily panel is roughly 49 times larger at the median than the index it was drawn from. When we later report that most tracked accounts grew, that sentence is about accounts of that size and no others.
Two other selection facts matter. Our whole Bluesky index began on 2026-06-10, so the earliest we have ever seen any account is 80 days ago, which means our first_seen column measures our crawler rather than the network and can never be read as a signup curve. And our index is built by graph traversal, so accounts enter it by being followed or by following somebody. Exactly one account in 3,864,250 carries zero followers, which is a property of that discovery method, not of Bluesky. The same discipline is applied in our TikTok growth benchmarks measured across 179,404 daily snapshots, where the fully measured cohort is defined before any growth number is quoted.
What percentage of Bluesky accounts have never posted?
Across our index of 3,864,250 Bluesky accounts, 499,393 have a post count of exactly zero, which is 12.923 percent. That is the first published dormancy rate for Bluesky that we are aware of, and it comes with a genuine uncertainty band that we would rather show than hide. The share depends heavily on how recently our crawler last refreshed a given account, and the two possible explanations for that pattern pull in opposite directions.
| When we last refreshed the account | Accounts | Share of index | Never posted | Median posts |
|---|---|---|---|---|
| Last 7 days (2026-08-22 onward) | 1,538,208 | 39.81% | 9.74% | 80 |
| 2026-08-01 to 2026-08-21 | 1,248 | 0.03% | 1.52% | 212 |
| July 2026 | 511,064 | 13.23% | 9.59% | 43 |
| June 2026 | 1,813,730 | 46.94% | 16.57% | 20 |
| Whole index | 3,864,250 | 100% | 12.92% | 37 |
Sample: n = 3,864,250 indexed accounts, grouped by the last date our crawler saw each one. The August 1 to 21 row holds 1,248 accounts and is shown for completeness rather than as a finding.
Two mechanisms produce that spread and we cannot separate them with these tables. Staleness is the first: an account we last checked in June may have posted since, which would mean 16.57 percent overstates current dormancy. Re-fetch selection is the second: the accounts our crawler returns to are the more prominent ones, which would mean 9.74 percent understates it. The honest statement is that our index-wide figure is 12.9 percent, that the freshly checked portion reads 9.7 percent and the stale portion reads 16.6 percent, and that the true network rate is very likely higher than all three, because a crawler that finds accounts through the follow graph systematically misses the most isolated ones.
One more framing is worth stating plainly. Zero posts is a floor, not a definition of dormancy. An account with four posts made eighteen months ago is dormant in every sense that matters to somebody deciding whether to keep publishing, and our post counts capture that account too.
How many Bluesky accounts have barely posted at all?
Across our index, 1,244,973 accounts, 32.2 percent, have posted fewer than ten times ever. That is the number we would lead with if we had to pick one, because it captures the population the never-posted figure misses: the accounts that were opened, used two or three times, and abandoned. The median indexed account has 37 posts and the 25th percentile has 5.
| Lifetime posts | Accounts | Share of index |
|---|---|---|
| 0 (never posted) | 499,393 | 12.92% |
| 1 to 4 | 458,525 | 11.87% |
| 5 to 9 | 287,055 | 7.43% |
| 10 to 49 | 848,193 | 21.95% |
| 50 to 199 | 754,949 | 19.54% |
| 200 to 999 | 631,232 | 16.34% |
| 1,000 or more | 384,902 | 9.96% |
Sample: n = 3,864,250 indexed Bluesky accounts. Post counts are as of each account's last refresh, so an account last seen in June carries its June value. One single row in the whole table holds a post count of -1, an obvious write error, and it is excluded from the buckets above, which is why they sum to 3,864,249.
Lifetime posting rate tells the same story from another direction. Dividing each account's post count by the number of days between its creation date and our last sighting of it, the median 2023-signup account posts once every 7.8 days, the median 2024 account once every 18.4 days, and the median 2025 account once every 40 days. Among 2025 signups, 53.9 percent have averaged less than one post per month across their entire life. That measure is generous to the account, because a burst of posting in week one and silence ever since still produces a respectable lifetime average, which means the true current rate of silence is worse than these figures show.
Anyone using post counts as a due-diligence signal should note the asymmetry: a high post count proves activity happened, but says nothing about when. Our index carries a cumulative counter, not a recency timestamp. A creator deciding whether Bluesky is worth their time should weigh the 32.2 percent alongside the growth figures further down, because the two populations barely overlap.
Which Bluesky signup cohorts went quiet, and which held up?
Dormancy on Bluesky rises steeply with how recently the account was created, and the pattern survives a control for elapsed time only up to a point. Among accounts created in the third quarter of 2023, 3.55 percent have never posted. Among accounts created in the second quarter of 2025, 27.27 percent have never posted. That is nearly eight times the rate, across two years of signups, measured on 3,861,854 accounts that carry a creation date.
| Signup quarter | Accounts in index | Never posted | Never posted, 90+ days old | Median posts | Median followers |
|---|---|---|---|---|---|
| 2023 Q2 | 80,800 | 4.21% | 4.21% | 251 | 455 |
| 2023 Q3 | 434,877 | 3.55% | 3.55% | 199 | 308 |
| 2023 Q4 | 350,699 | 7.37% | 7.37% | 72 | 188 |
| 2024 Q1 | 177,405 | 7.95% | 7.95% | 60 | 139 |
| 2024 Q2 | 92,286 | 6.22% | 6.22% | 54 | 176 |
| 2024 Q3 | 475,538 | 10.93% | 10.93% | 38 | 99 |
| 2024 Q4 | 1,391,011 | 13.01% | 13.01% | 31 | 154 |
| 2025 Q1 | 373,906 | 20.80% | 20.80% | 13 | 64 |
| 2025 Q2 | 162,941 | 27.27% | 27.27% | 6 | 84 |
| 2025 Q3 | 82,839 | 22.79% | 22.79% | 13 | 59 |
| 2025 Q4 | 67,037 | 19.95% | 19.95% | 16 | 44 |
| 2026 Q1 | 72,604 | 22.95% | 22.72% | 12 | 33 |
| 2026 Q2 | 76,205 | 29.49% | 19.39% | 6 | 24 |
| 2026 Q3 | 21,048 | 33.06% | not computable | 4 | 20 |
Sample: n = 3,861,854 indexed Bluesky accounts carrying a creation date, which is 99.9 percent of the index. The fourth column repeats the calculation on only those accounts we observed at least 90 days after their creation date, which is why it is identical for every cohort older than mid-2025 and shrinks the newest ones. Two quarters before 2023 Q2 exist in our data and are omitted here: 2022 Q4 holds 46 accounts and 2023 Q1 holds 2,612, both too small to sit next to six-figure cohorts without misleading.
The elapsed-time control is the reason we will not publish the headline the raw table invites. Read straight, the 2026 Q3 cohort looks catastrophic at 33.06 percent never posted. Restricted to accounts we watched for at least 90 days after signup, the 2026 Q2 figure falls from 29.49 percent to 19.39 percent across 16,021 accounts, and 2026 Q3 disappears entirely because no account in it is yet 90 days old. A large part of the apparent collapse in the newest cohorts is simply accounts that have not had time to post yet.
What survives the control is the 2025 story. Accounts created in the first three quarters of 2025 sit between 20.80 percent and 27.27 percent never posted, every one of those accounts is at least a year old, and none of them can be explained away by insufficient elapsed time. Something changed between the 2023 and 2024 signup waves and the 2025 ones, and our data shows the effect without being able to name the cause. The obvious confound runs the other way: older cohorts have had more time for their quietest members to be deleted or to fall out of the follow graph and therefore out of our reach, which would flatter them.
What happened to the November 2024 wave?
November 2024 is the single largest signup month in our entire Bluesky index, at 1,006,564 accounts, and 33.75 percent of that cohort has posted fewer than ten times in the 21 months since. We captured 26.05 percent of our whole index from that single month, and no other month between September 2024 and August 2026 contributed more than 237,161 accounts. That concentration is corroboration of the post-election migration that the public narrative describes, measured from a completely different angle than an app panel.
The cohort's current state is the interesting part. Of the 1,006,564 accounts created in November 2024 and present in our index, 131,050 have never posted, giving 13.02 percent. A further 208,684 have posted between one and nine times, bringing the under-ten total to 339,734. Across their whole life, 43.58 percent of the cohort has averaged less than one post per month. The median November 2024 account holds 32 posts and 173 followers.
The cohort figures should be read as a floor on its decay, for the same staleness reason as before: post counts are as of our last sighting, and 21 months of possible activity are compressed into a single cumulative counter with no recency information attached. A November 2024 account with 32 posts might have made all 32 in its first fortnight. Our tables cannot separate that account from one posting steadily, and we are not going to pretend otherwise.
Does a finished profile predict whether an account ever posts?
Accounts that filled in a bio are roughly ten times less likely to have never posted than accounts that did not, across our full index of 3,864,250 accounts. Among the 2,976,340 accounts with both a bio and an avatar, 5.55 percent have never posted. Among the 45,977 accounts with neither, 53.71 percent have never posted and the median post count is zero. Profile completeness is the strongest single predictor of ever having posted that we can compute from account fields alone.
| Profile state | Accounts | Share of index | Never posted | Median posts | Median followers |
|---|---|---|---|---|---|
| No bio, no avatar | 45,977 | 1.19% | 53.71% | 0 | 42 |
| No bio, has avatar | 820,010 | 21.22% | 37.14% | 2 | 52 |
| Has bio, no avatar | 21,923 | 0.57% | 23.10% | 9 | 106 |
| Has bio and avatar | 2,976,340 | 77.02% | 5.55% | 64 | 172 |
Sample: n = 3,864,250 indexed Bluesky accounts. The four rows reconcile exactly to the index total and to the 499,393 never-posted total. A bio counts as present when the description field is non-empty, and an avatar counts as present when the photo URL field is non-empty.
Correlation is the correct word here, not cause. Writing a bio does not make somebody post; the same intention that produces a bio produces posts, and a bio can also be written months after the first post. A second confound is our own discovery method: an account with no bio and no avatar is less likely to attract follows, less likely to be traversed, and therefore underrepresented in our index relative to how common it is on the network. The direction of that bias means the real share of blank, silent Bluesky accounts is probably higher than 1.19 percent of the population.
Are the never-posted Bluesky accounts abandoned, or just reading?
Of the 499,393 Bluesky accounts in our index that have never posted, 194,637 follow 50 or more other accounts, which is 38.97 percent of the silent population. Only 9,491, or 1.90 percent, follow nobody at all. A silent account carrying a 200-account reading list is a lurker with a curated feed, not an abandoned shell, and treating the two as one number is the main way dormancy statistics mislead.
| Accounts the silent account follows | Never-posted accounts | Share of silent population | Median followers | Has a bio |
|---|---|---|---|---|
| 0, follows nobody | 9,491 | 1.90% | 49 | 40.41% |
| 1 to 9 | 130,102 | 26.05% | 9 | 28.13% |
| 10 to 49 | 165,163 | 33.07% | 20 | 33.60% |
| 50 to 199 | 122,276 | 24.48% | 52 | 38.01% |
| 200 or more | 72,361 | 14.49% | 162 | 38.29% |
Sample: n = 499,393 indexed Bluesky accounts with a post count of exactly zero, grouped by how many accounts they follow. The five rows reconcile exactly to the never-posted total. Follow counts are as of each account's last refresh by our crawler.
Three things fall out of that split. First, a network with 194,637 committed readers among its silent accounts is behaving differently from one with 194,637 dead shells, and only account data can tell the two apart. Second, the smallest group, the 9,491 accounts following nobody, are also the ones with the highest bio rate at 40.41 percent, which is an odd combination: a filled-in profile and no follows and no posts is the signature of an account created deliberately and then left, perhaps to reserve a handle. Third, the median follower count rises with the follow count, from 9 followers for accounts following one to nine others up to 162 for accounts following 200 or more, which is what a reciprocal-follow culture produces.
One boundary is worth drawing on that last point. Our engine holds the Bluesky follow graph in a separate table that this article does not query, so the reading-list figures above come from each account's own follow counter rather than from traversed edges. The counter is the platform's own number and is refreshed whenever we refresh the profile, which for 46.94 percent of our index was some time in June 2026.
Are the Bluesky accounts we track every day still growing?
Among a strictly defined panel of 29,114 large Bluesky accounts observed on both 2026-06-10 and 2026-08-28, 88.51 percent gained followers over the 79 days between, and the median account added 250. That result appears to contradict a decline narrative, and it does not, because of what the panel is. Every single account in it already held at least 5,000 followers on the first day of the window. We checked for smaller ones and found none.
The panel definition matters as much as the result. We recorded 2,751,231 daily snapshots across 134,498 accounts, but those snapshots are not evenly spread: the mean account has 20.5 observation days and the median has 7. To get a defensible growth measurement we required presence on the first and last day of the window plus at least 60 observation days, which leaves 29,114 accounts, 0.75 percent of our index and 21.6 percent of the tracked cohort.
| Follower count on 2026-06-10 | Panel accounts | Added no posts | No follower gain | Median posts added | Median followers added | Median growth |
|---|---|---|---|---|---|---|
| Under 5,000 | 0 | n/a | n/a | n/a | n/a | n/a |
| 5,000 to 19,999 | 16,945 | 22.51% | 11.43% | 46 | 179 | 1.28% |
| 20,000 to 99,999 | 11,256 | 18.91% | 11.66% | 90 | 374 | 1.13% |
| 100,000 or more | 913 | 13.47% | 10.62% | 135 | 829 | 0.53% |
Sample: n = 29,114 Bluesky accounts observed on 2026-06-10 and 2026-08-28 with at least 60 observation days each, drawn from 2,751,231 daily snapshots. The first row is empty because no account below 5,000 followers met the panel criteria, which is the selection effect stated as a measurement rather than as a caveat.
Growth inside that panel is real but slow. The median account gained 1.177 percent of its follower count over 79 days. Compounded, an account holding that exact pace would need roughly 12.8 years to double. The 90th percentile gained 6.956 percent over the same window and the 10th percentile lost 4 followers. Aggregate follower additions across the panel came to 21,561,624, which sounds enormous and describes 29,114 accounts that already had audiences, so it says nothing at all about the other 3,835,136 accounts in our index.
One negative result is worth recording because it looked like a finding and was not. 37.06 percent of panel accounts ended the window below their own in-window peak, which reads like widespread decline. Only 18 accounts out of 29,114, 0.06 percent, ended more than one percent below their peak. The 37 percent is day-to-day wobble of a handful of followers and we are not publishing it as anything else. Our broader piece on how most social accounts are shrinking across 6 million daily snapshots covers the cross-platform version of this question; the Bluesky panel here is a narrower and larger-account slice of it.
Do older Bluesky accounts keep posting more than newer ones?
Inside the daily panel, the share of accounts that posted nothing across 79 days doubles between the 2023 and 2025 signup cohorts, from 14.41 percent to 29.08 percent. Every account in this comparison is a large account with at least 5,000 followers that we watched on both window endpoints, so signup year is the only thing varying. The cohort effect visible in the index-wide dormancy table survives inside the panel, at a much smaller scale and among accounts that all have real audiences.
| Signup year | Panel accounts | Posted nothing in 79 days | No follower gain | Median posts added | Median followers added |
|---|---|---|---|---|---|
| 2023 | 11,884 | 14.41% | 6.77% | 96 | 284 |
| 2024 | 15,732 | 24.97% | 14.76% | 42 | 212 |
| 2025 | 1,451 | 29.08% | 14.96% | 47 | 342 |
Sample: n = 29,067 of the 29,114 panel accounts, drawn from 2,751,231 daily snapshots. Two further rows exist in our output and are excluded here as underpowered: 10 panel accounts created in 2022 and 37 created in 2026. The 2026 row is also a survivorship artifact, since an account created this year that has already reached the daily-tracked panel is by definition an outlier, and we will not publish a rate from it.
The 2023 cohort posts more than twice as much as the 2024 cohort at the median, 96 posts against 42 over the same 79 days, and is less than half as likely to have gone silent. Follower gains do not follow the same order: the 2025 cohort gained a median 342 followers against 284 for 2023, which is what a smaller, newer, faster-compounding base tends to do. Two accounts of the same size but different vintages are therefore not the same asset, and the older one is measurably more likely to still be publishing.
One caution belongs on the 2025 row specifically. At 1,451 accounts it is more than large enough to report, but it is a heavily selected group: a 2025 account that already holds 5,000 followers and earned daily tracking within a year is not a typical 2025 account, and its 29.08 percent silence rate should be read as the silence rate of successful newcomers rather than of newcomers.
Did Bluesky posting slow down between June and August 2026?
Posting fell and follower accumulation held steady, across 29,470 accounts observed on four specific dates. We compared two exactly equal 31-day windows: 2026-06-10 to 2026-07-11, and 2026-07-28 to 2026-08-28. The median account added 26 posts in the first window and 21 in the second, a drop of 19.2 percent. Over the same two windows the median follower gain was 90 and then 89, which is flat.
| Measure | 2026-06-10 to 2026-07-11 | 2026-07-28 to 2026-08-28 | Change |
|---|---|---|---|
| Median posts added | 26 | 21 | -19.2% |
| Median followers added | 90 | 89 | -1.1% |
| Share adding no posts | 24.37% | 26.43% | +2.06 points |
| Window length | 31 days | 31 days | identical |
Sample: n = 29,470 Bluesky accounts present in our snapshots on all four of those dates. All four endpoints are dense crawl days carrying between 35,961 and 48,207 rows, which is why they were chosen instead of a naive first-month against last-month split.
Two confounds sit on top of that result and neither can be removed with 79 days of data. Seasonality is the first: the second window covers late July and August, when northern-hemisphere posting volume routinely dips, and a single summer gives no way to separate a seasonal dip from a trend. Panel composition is the second: these are large accounts, so a slowdown among them says nothing about smaller accounts, whose posting we do not observe over time at all. What we can state is narrow and checkable. Among 29,470 large Bluesky accounts, median posting volume fell about a fifth between two equal windows in mid-2026 while median follower accumulation did not move.
The share of accounts posting nothing at all in a window rose from 24.37 percent to 26.43 percent, an increase of about two points. Those two figures are the closest thing in our data to the story the app panel is telling, and they are far milder than a 27 percent year-over-year fall in sessions. Both can be true: an account can post at the same slightly reduced rate while the people reading it open the app less often.
How much does posting actually move follower growth?
Bluesky accounts in our panel that added 200 or more posts grew 31 times faster in percentage terms at the median than accounts that added none, and the two groups started at almost the same size. Panel accounts that posted nothing over the 79 days gained a median of 15 followers, or 0.086 percent. Panel accounts that added 200 or more posts gained a median of 622 followers, or 2.711 percent. The median follower count at the start of the window was 16,764 for the silent group and 19,452 for the most prolific, which is close enough to rule out account size as the explanation.
| Posts added, 2026-06-10 to 2026-08-28 | Panel accounts | Median followers at start | Median followers added | Median growth | Flat or lost followers |
|---|---|---|---|---|---|
| 0 | 6,066 | 16,764 | 15 | 0.086% | 37.55% |
| 1 to 9 | 3,102 | 16,367 | 71 | 0.390% | 18.21% |
| 10 to 49 | 4,491 | 16,993 | 193 | 0.977% | 6.72% |
| 50 to 199 | 5,749 | 17,794 | 333 | 1.611% | 2.45% |
| 200 or more | 9,706 | 19,453 | 622 | 2.711% | 0.62% |
Sample: n = 29,114 Bluesky accounts in the fully measured panel, each observed on both window endpoints with at least 60 observation days. The five rows reconcile exactly to the panel total.
Accounts that posted more also grew more, and that sentence is deliberately not a causal claim. Two confounds are obvious and neither is testable here. Reverse direction is the first: an account that starts gaining followers has an incentive to post more, so growth can drive posting rather than the other way round. A shared third cause is the second: an account run by somebody with a live project, a book launch or a news beat will show both high posting and high growth, and the project explains both. What the table does establish is that silence is not free. Among panel accounts that posted nothing, 37.55 percent ended the window flat or down, against 0.62 percent of the most prolific group.
Anybody planning a posting cadence from that table should treat the follower numbers as ceilings for accounts of that size and nothing else, since the panel starts at 5,000 followers. Our follower growth simulator lets you model a cadence against a starting size, while the Bluesky follower percentile rank tool linked below shows where a given follower count sits in our full index rather than in the panel.
Why is Bluesky's registered count so far above its active count?
The gap between roughly 46 million registered Bluesky users and any active-user figure is mostly accounts that were created and never used, and our index measures that population directly for the first time. Registration on Bluesky costs nothing and takes a minute, and at least one very large migration wave pushed more than a million accounts through that minute in a single month, by our count. Our index shows what the waves left behind: 12.9 percent of accounts with zero posts, 32.2 percent with fewer than ten, and a November 2024 cohort of 1,006,564 accounts in which a third has posted fewer than ten times in 21 months.
Scale markers help here. The most-followed account in our entire Bluesky index is the platform's own account at 34,699,118 followers, measured on 2026-08-28. That number is not a user count and should never be used as one, since it reflects follow behaviour and onboarding suggestions rather than registrations, but it does establish the order of magnitude the network operates at. Against it, 10.4 million monthly mobile sessions and 3,864,250 accounts in our index are three different measurements of three different things.
The same registered-versus-active gap exists on every large network and gets reported the same misleading way. Our own X follower count benchmarks across 17 million accounts cover the equivalent distribution on X. Bluesky is the younger network, so its dormancy is concentrated in recent signup cohorts, which our quarterly table shows clearly, whereas a network fifteen years older has had time to spread its inactive accounts across every vintage.
What the Similarweb panel measures and what our index measures
A mobile-app panel and an account index answer questions that do not overlap, and conflating them is the mistake running through the whole August 2026 news cycle. The figures repeated across TechCrunch and its syndications come from Similarweb: about 10.4 million monthly active users on the mobile app in June 2026, mobile daily active users near 3 million in July, a stickiness ratio around 29 percent, and a decline of roughly 52 percent from the fourth quarter of 2024. The original report is TechCrunch on Bluesky's shrinking active user base, published 11 August 2026.
A panel of that kind estimates how many phones opened an app. It does not see the Bluesky web client, it does not see third-party AT Protocol clients, it does not see accounts, and it does not distinguish an account that was deleted from one whose owner switched to a laptop. None of that makes the panel wrong. It makes it a measurement of app usage, which is exactly what it says it is.
Our index has the mirror-image limitation, and it is important to say so rather than to imply that account data refutes a session panel. We hold zero session data. We cannot tell you how many people opened Bluesky yesterday, we cannot compute a daily active user figure, and nothing in this article contradicts the Similarweb numbers. What our tables add is the axis nobody was measuring: the state of the accounts themselves. When somebody asks "is bluesky dead", the app panel answers "fewer phones are opening it" and our index answers "12.9 percent of accounts never posted and the large ones are still growing about one percent over 79 days".
The columns we refused to use
Four columns in our Bluesky tables looked useful and were discarded after testing, and naming them is part of making the rest of the numbers trustworthy. Each one was checked before anything was built on it.
- daily_growth and growth_pct. Both look like one-day follower deltas and are not. Our crawler missed 2026-07-13 through 2026-07-18 and 2026-07-22 entirely, and on the first day back a single row reported a growth value covering seven calendar days. The column is a change-since-last-observation figure, and 166,254 of 2,751,231 rows are empty besides. Every growth number in this article is a first-to-last delta between two named dates instead.
- followers_count as a dormancy signal. Exactly one account out of 3,864,250 carries zero followers. We tested whether the column was defaulted or backfilled and it is neither: the low end is a smooth curve from 17,614 accounts at one follower to 26,164 at eight, the sibling columns store 27,515 zeros for accounts following nobody, and a 10 percent sample of the final day showed the stored value agreeing exactly with the same day's snapshot 68.3 percent of the time. The floor at one follower is a property of graph-traversal discovery, so no statistic here is built on zero-follower accounts.
- country. Empty for all 3,864,250 rows. No geographic breakdown of Bluesky activity is possible from our data and none appears above.
- status. One value, "active", for every row. We cannot see suspensions, deletions or deactivations, which means our dormancy figures describe accounts that still resolve, not accounts that still exist in some stronger sense.
One more thing was rejected on method rather than on data quality. Our snapshot volume swings from 1,952 rows on the worst day to 48,207 on the best, so any chart of activity by day of week would be measuring our own crawl schedule rather than Bluesky. No such chart appears in this article, and any Bluesky day-of-week statistic built on a crawler's snapshot counts should be treated the same way.
What this data cannot tell you
Our Bluesky tables carry four structural blind spots, and every conclusion above should be read through them. The first and largest is selection. Our index of 3,864,250 accounts is 8.4 percent of Bluesky's stated registered base, and it was assembled by traversing the follow graph, which means an account with no inbound and no outbound follows is invisible to us. Whatever the true dormancy rate is on Bluesky, our 12.9 percent is more likely to be under it than over it, because the accounts we cannot see are the least connected ones.
The second blind spot is the daily panel. Only 3.5 percent of our indexed accounts get daily tracking at all, and the fully measured panel narrows that to 29,114 accounts, every one of which held at least 5,000 followers on day one. Growth, posting cadence and the two-window comparison are all statements about large Bluesky accounts. Nothing in this article measures growth for a typical account, because we do not have a time series for typical accounts.
| Observation days per tracked account | Accounts | Snapshot rows | Share of rows |
|---|---|---|---|
| 1 day only | 24,210 | 24,210 | 0.88% |
| 2 to 6 days | 41,658 | 133,843 | 4.86% |
| 7 to 13 days | 32,832 | 309,447 | 11.25% |
| 14 to 29 days | 523 | 10,610 | 0.39% |
| 30 to 59 days | 2,715 | 129,354 | 4.70% |
| 60 to 73 days | 32,560 | 2,143,767 | 77.92% |
Sample: n = 134,498 tracked Bluesky accounts and 2,751,231 daily snapshots, 2026-06-10 to 2026-08-28. The distribution has two peaks and an almost empty valley at 14 to 29 days, which is why a mean of 20.5 observation days is misleading and the median of 7 is the number to quote.
The third blind spot is time. Our whole Bluesky index is 80 days old, our snapshot window covers 73 days that actually carry data, and 7 calendar days inside it are missing because the crawler stopped between 2026-07-13 and 2026-07-18 and again on 2026-07-22. Any seasonal effect, any platform change older than June 2026, and any comparison to 2024 or 2025 activity levels is out of reach. Cohort analysis by signup date is the only historical axis available, and it reads the past through accounts that survived to be indexed today.
The fourth blind spot is the absence of recency. Our post counter is cumulative, with no timestamp on the last post, so we can say an account has 32 posts and cannot say whether it made them last week or in November 2024. That limitation cuts one way only: it means our dormancy figures are conservative, since an account with a handful of ancient posts counts as active in every table above.
Two things we specifically do not measure deserve their own sentence. We hold no engagement data for Bluesky, so nothing here says whether anyone reads what gets posted. And we hold no session data at all, so the question of how many people open the Bluesky app is one our tables cannot address in either direction.
Questions and answers about Bluesky account activity
What percentage of Bluesky accounts have never posted?
Across the 3,864,250 Bluesky accounts our engine indexes, 499,393 carry a post count of zero, which is 12.92 percent. The figure varies with how recently we refreshed each account: the portion checked in the last seven days reads 9.74 percent and the portion last checked in June reads 16.57 percent. Because our crawler finds accounts through the follow graph, the least connected accounts are missing entirely, so the true network rate is probably higher than 12.92 percent.
Is Bluesky dead in 2026?
Not by any account-level measure available to us. Among 29,114 large Bluesky accounts we tracked daily from 2026-06-10 to 2026-08-28, 88.51 percent gained followers and the median added 250. At the same time, 32.2 percent of all 3,864,250 indexed accounts have posted fewer than ten times ever. A network can hold a large silent population and a growing active one simultaneously, and Bluesky does.
Is Bluesky still growing or shrinking?
Our data can answer that only for accounts, not for usage, and only for large accounts at that. In the 29,114-account panel, aggregate followers rose by 21,561,624 over 79 days and the median account grew 1.177 percent. Across two equal 31-day windows the median follower gain was 90 and then 89, essentially flat. Median posting volume in the same windows fell from 26 to 21 posts, a drop of 19.2 percent.
How many Bluesky accounts are actually active?
Depends entirely on the definition, which is why the question produces such different answers. Using "has ever posted", 87.08 percent of our 3,864,250 indexed accounts qualify. Using "has posted at least ten times", 67.78 percent qualify. Using "has averaged at least one post per month across its life", 53.86 percent of the 2025 signup cohort fails that bar. No single number is right, so we publish the thresholds.
Why do these figures differ from the widely quoted 10.4 million?
The 10.4 million monthly active user figure comes from a Similarweb mobile-app panel that counts phone sessions, not accounts. Our numbers count accounts and their posts, captured by crawling profiles. Neither measurement can substitute for the other: we cannot see app sessions and the panel cannot see whether an account ever posted. Any article that treats the two as interchangeable is comparing a usage estimate with a population count.
How many followers does a tracked Bluesky account have?
Among the 134,498 Bluesky accounts our engine tracks daily, the median holds 6,124 followers, the 25th percentile 4,281 and the 75th percentile 10,537. That cohort is not representative: across the 3,729,752 accounts we index but do not track daily, the median is 124 followers. Anyone benchmarking a real account should use the full distribution rather than the tracked slice, which our Bluesky follower rank tool reports.
Is it still worth posting on Bluesky?
Our panel shows a strong association between posting and growth that we cannot call causal. Panel accounts adding 200 or more posts over 79 days gained a median 622 followers, or 2.711 percent, while accounts adding none gained a median 15, or 0.086 percent, from an almost identical starting size. Among the silent group, 37.55 percent ended flat or down against 0.62 percent of the most prolific group.
How often does our crawler refresh a Bluesky account?
Refresh frequency depends on the account's crawl tier. All 35,929 accounts in tiers S, A and B receive a daily snapshot, along with 98,569 of the 3,828,321 tier C accounts. The remainder are refreshed opportunistically: 39.81 percent of our index was last seen within the previous seven days, and 46.94 percent was last seen in June 2026. Post and follower counts always reflect the most recent refresh, not today.
What to check next if you hold a Bluesky account
Three checks follow directly from the numbers above, and none of them requires trusting our aggregate figures. Start with your own position in the full distribution rather than in any panel: our Bluesky follower percentile rank places a follower count against our full Bluesky index, which is a far harsher benchmark than the 6,124 median of the accounts we track daily. A follower count that looks small against the tracked cohort often sits in the top few percent of the network.
Second, treat post count as a floor and go find the recency yourself. Our index stores a cumulative counter with no last-post timestamp, so an account showing 32 posts might be posting weekly or might have stopped in 2024. Anyone valuing, buying or partnering with an account should open the profile and read the dates. The same discipline applies on every platform, and our follower authenticity audit and X follower percentile rank exist for exactly that reason on the X side.
Third, decide what "active" means before quoting anyone's activity statistic, including ours. Bluesky dormancy is 12.92 percent under a zero-posts definition, 32.22 percent under a fewer-than-ten definition, and unmeasurable under a "posted this month" definition that nobody, including us, can currently compute at network scale. Browse the accounts we do rank in our Bluesky accounts directory, and see how the same measurement discipline plays out across platforms in our insights reports. For the platforms where accounts genuinely change hands, the PlayerSells marketplace shows what is listed today, and our sibling Bluesky article covers the separate question of whether a Bluesky account can be transferred at all.
We will re-run every query in this article as the window lengthens. The two numbers worth watching are the never-posted share of the 2025 and 2026 signup cohorts, which is the cleanest available signal of whether new Bluesky accounts are being used, and the share of tracked accounts posting nothing in a 31-day window, which moved from 24.37 percent to 26.43 percent across our only two comparable windows so far. Neither is a verdict yet. Both are measurable, which is more than the current public numbers can say.
Free tools for this topic

Published by the PlayerSells editorial team. Data comes from PlayerSells marketplace records and our own crawlers. About PlayerSells · Editorial policy
Related Articles
Continue learning with these related guides.

Bluesky Account Statistics 2026: 3.9 Million Accounts, and Whether You Can Actually Sell One
Bluesky account statistics from an index of 3,927,915 accounts: follower tiers, cohort decay, custom domain handles, and whether selling one is allowed.

LinkedIn Company Page Benchmarks From 29,742 Real Pages
We measured 29,742 LinkedIn company pages. The median engagement rate is 0.1685 percent of followers, not the 2 percent that benchmark posts quote.

Buy an X account or grow one: the honest math on cost
Buy an X account or grow one? Only 8.118% of tracked accounts ever hit 10,000 followers. Real prices, real hours and the cases where buying loses.