

LinkedIn Company Page Benchmarks From 29,742 Real Pages
We measured 29,742 LinkedIn company pages. The median engagement rate is 0.1685 percent of followers, not the 2 percent that benchmark posts quote.
The median LinkedIn company page in our index gets 0.1685 percent of its followers to react to a post. We measured that across 21,428 company pages that had at least five recent posts visible on 2026-08-27, and it is roughly one twelfth of the 2 percent engagement rate that circulates in LinkedIn benchmark write-ups. In our data the 2 percent figure is not a median. It sits above the 90th percentile.
PlayerSells indexed 29,742 LinkedIn company pages between 2026-08-22 18:52 UTC and 2026-08-27 01:00 UTC, together with 275,435 people rows attached to those companies, 81,279 contact records, 307,962 page-to-page relationships and 59,971 outbound social links found on company websites. This article publishes what those pages actually look like: how many followers a company of a given size normally has, how many of those followers react, and how much of the B2B contact data that gets sold as a list is really sitting on the public web.
The most useful number in the whole set is one almost nobody publishes: followers per employee. The median LinkedIn company page in our 2026-08-27 index carries 86.4 followers for every associated employee. A page with 40,000 followers is unremarkable at 500 staff and remarkable at 50. Any benchmark that reports raw follower counts without dividing by headcount is measuring company size and calling it marketing performance.
How we measured 29,742 LinkedIn company pages
Every number in this article comes from our own LinkedIn crawl, frozen at one instant so that the figures stay consistent with each other. The crawler was still inserting rows while we worked, so we fixed the cohort at all company pages first seen before 2026-08-27 01:00 UTC. That cohort contains exactly 29,742 company pages. The index itself was built between 2026-08-22 18:52 UTC and 2026-08-27 01:00 UTC, which makes this a cross-section of the last week of August 2026 rather than a time series.
Column fill rates decide what can honestly be published, so we checked all of them before quoting anything. In the 29,742 page cohort, industry is present on 29,687 pages (99.8 percent), size band on 29,645 (99.7 percent), associated staff count on 28,010 (94.2 percent), follower count on 27,552 (92.6 percent), average reactions on 24,634 (82.8 percent), country code on 24,688 (83.0 percent), founded year on 20,086 (67.5 percent) and specialties on 18,694 (62.9 percent). Anything measured below those denominators is stated with its own n in the tables that follow.
Two data-quality decisions shape every follower number here, and both are disclosed rather than hidden. First, 12 of the 27,552 pages with a follower count carry values above 50,000,000, topping out at 2,001,198,312. LinkedIn has no page anywhere near that size, and the values are phone-number shaped integers that landed in the wrong field during parsing. We excluded all follower values above 50,000,000, which drops 12 rows, or 0.04 percent of the follower population. Second, the average reactions column is stored as an integer with a floor of 1, so a page that truly averages less than one reaction per post is recorded as 1. That rounding pushes our engagement rate estimates up slightly, which means the true median is if anything even lower than the 0.1685 percent we report.
Engagement figures use only pages where our engine could sample at least five recent posts. The engine samples up to ten posts per page and the median page in the cohort yielded nine. Requiring five or more sampled posts leaves 21,495 pages, of which 21,428 also carry a plausible follower count, and every engagement table in this article is built on that 21,428-page subset. Medians and percentiles are computed with percentile_cont, never with averages, because on LinkedIn follower data the mean is not close to the middle of anything.
How many followers does a normal company page have?
The median LinkedIn company page in our index has 15,487 followers, and the mean has 401,435. That gap, a mean 25.9 times the median, is the single reason almost every published LinkedIn follower benchmark is wrong: they report an average across a distribution where the top of the market swamps everything else. Across the 27,540 pages in the cleaned follower cohort, the top 1 percent of pages hold 39.50 percent of all 4,164,549,939 follows we counted, the top 10 percent hold 79.24 percent, and the entire bottom half of the index holds 1.54 percent between them.
Follower counts are only interpretable next to company size, so the table below reports percentiles inside each self-declared LinkedIn size band. Find your band, then read across. If your page sits between the P25 and P75 column you are in the ordinary middle of companies your size, whatever a benchmark post told you.
| Company size band | Pages | P10 | P25 | Median | P75 | P90 | Mean |
|---|---|---|---|---|---|---|---|
| 2 to 10 employees | 3,043 | 58 | 248 | 1,056 | 5,029 | 26,216 | 34,979 |
| 11 to 50 employees | 5,233 | 355 | 1,179 | 3,561 | 10,088 | 30,511 | 25,122 |
| 51 to 200 employees | 5,933 | 1,577 | 4,402 | 11,220 | 26,058 | 61,005 | 41,583 |
| 201 to 500 employees | 3,443 | 3,051 | 8,836 | 23,783 | 56,956 | 121,742 | 82,260 |
| 501 to 1,000 employees | 2,422 | 4,722 | 15,603 | 42,030 | 91,724 | 186,843 | 126,947 |
| 1,001 to 5,000 employees | 3,789 | 6,857 | 24,338 | 72,900 | 182,673 | 372,209 | 184,545 |
| 5,001 to 10,000 employees | 1,089 | 10,236 | 45,754 | 140,960 | 360,248 | 679,260 | 293,433 |
| 10,001 or more employees | 2,220 | 15,686 | 79,257 | 318,261 | 903,023 | 2,058,367 | 922,536 |
Sample: n = 27,172 LinkedIn company pages with both a follower count and a size band, follower values capped at 50,000,000, measured from the PlayerSells LinkedIn index frozen at 2026-08-27 01:00 UTC. The self-declared "1 employee" band, 323 pages, is omitted from this table because it is internally incoherent: across the 197 pages in that band where both values are available, the median associated member count is 12, which contradicts the band label.
Read the mean column against the median column in every row of the LinkedIn follower table above. In the 2 to 10 employee band the mean of 34,979 followers is larger than the P90 of 26,216, which means the arithmetic average for micro companies describes fewer than one page in ten. In every single band the mean exceeds the P75. If a benchmark quotes you an average LinkedIn company page follower count, it is quoting a number that most pages of that size never reach.
Why followers per employee is the benchmark nobody publishes
Followers per employee is the metric that turns a LinkedIn follower count into something comparable, and the median across our index is 86.4. We computed it as follower count divided by the associated member count LinkedIn shows on the page, for the 26,439 pages in the 2026-08-27 cohort that carry both. The distribution runs from 17.9 at the 10th percentile to 38.0 at P25, 86.4 at the median, 195.5 at P75 and 466.1 at P90. The mean is 813.5, which is 9.4 times the median, so once again the average is useless as a target.
The ratio falls steadily as companies get larger, and that is the whole reason raw follower comparisons mislead. A 30-person agency at the median carries 130.8 followers per employee. A 15,000-person enterprise at the median carries 33.9. The enterprise has vastly more followers in absolute terms and a fraction of the audience per head.
| Company size band | Pages | Followers per employee P25 | Median | P75 | Median followers | Median associated staff |
|---|---|---|---|---|---|---|
| 2 to 10 employees | 2,567 | 53.2 | 164.5 | 462.9 | 1,441 | 8 |
| 11 to 50 employees | 5,024 | 56.4 | 130.8 | 294.3 | 3,794 | 28 |
| 51 to 200 employees | 5,838 | 57.7 | 112.2 | 223.4 | 11,499 | 103 |
| 201 to 500 employees | 3,397 | 43.0 | 89.1 | 172.8 | 24,157 | 288 |
| 501 to 1,000 employees | 2,395 | 36.1 | 74.9 | 140.7 | 42,643 | 599 |
| 1,001 to 5,000 employees | 3,734 | 27.5 | 54.3 | 107.4 | 74,573 | 1,522 |
| 5,001 to 10,000 employees | 1,069 | 22.3 | 43.7 | 84.5 | 141,839 | 4,027 |
| 10,001 or more employees | 2,184 | 18.0 | 33.9 | 64.9 | 328,807 | 11,067 |
Sample: n = 26,208 LinkedIn company pages carrying a follower count, an associated staff count and a size band, follower values capped at 50,000,000, measured 2026-08-27. The incoherent "1 employee" band is again excluded.
Use the followers-per-employee table as a scorecard rather than a target. Take your follower count, divide by the number of employees LinkedIn shows on your page, and find your band. If a 90-person company has 6,000 followers, that is 66.7 per employee, which sits between the P25 of 57.7 and the median of 112.2 for the 51 to 200 band. That company is normal, slightly below the middle, and no amount of posting cadence advice will change the fact that its headcount is the dominant term. The same arithmetic applied across platforms is why our engine work on account benchmarks keeps returning to ratios rather than totals, a pattern we also documented in our analysis of X follower count benchmarks across 17 million accounts.
What is the real engagement rate on a LinkedIn company page?
The real median engagement rate on a LinkedIn company page is 0.1685 percent of followers reacting per post, and it collapses as the page gets bigger. We computed engagement rate as average reactions per post divided by follower count, on the 21,428 pages in the 2026-08-27 cohort with at least five sampled posts and a plausible follower count. The distribution is 0.0180 percent at P10, 0.0524 percent at P25, 0.1685 percent at the median, 0.5285 percent at P75, 1.4550 percent at P90 and 9.5529 percent at P99. The mean, 1.0736 percent, is 6.4 times the median.
The single clearest result in our LinkedIn data is that engagement rate is a function of follower count far more than of anything a social media manager controls. Sorted by follower band rather than by employee count, the median rate falls 171.6 times from the smallest pages to the largest, while median reactions per post rise only 17 times over the same range.
| Follower band | Pages | Median reactions per post | Engagement rate P25 | Median | P75 | P90 |
|---|---|---|---|---|---|---|
| Under 1,000 | 1,499 | 9 | 1.0417% | 2.3677% | 5.0174% | 11.0512% |
| 1,000 to 4,999 | 3,431 | 21 | 0.3867% | 0.7884% | 1.5101% | 2.6220% |
| 5,000 to 9,999 | 2,462 | 27 | 0.1994% | 0.3800% | 0.6927% | 1.1576% |
| 10,000 to 49,999 | 6,485 | 39 | 0.0876% | 0.1720% | 0.3312% | 0.5933% |
| 50,000 to 99,999 | 2,440 | 58 | 0.0400% | 0.0830% | 0.1585% | 0.2981% |
| 100,000 to 499,999 | 3,696 | 79 | 0.0186% | 0.0392% | 0.0790% | 0.1540% |
| 500,000 or more | 1,415 | 153 | 0.0062% | 0.0138% | 0.0283% | 0.0558% |
Sample: n = 21,428 LinkedIn company pages with at least five sampled posts, a plausible follower count and a recorded reaction average, measured from the PlayerSells LinkedIn index frozen at 2026-08-27 01:00 UTC. Engagement rate is average reactions per post divided by follower count.
The practical consequence of that table is that engagement rate is not comparable across page sizes, and comparing yours to an all-industry average is a category error. A page with 700 followers and a median 2.3677 percent rate and a page with 800,000 followers and a median 0.0138 percent rate are both completely typical. Neither page is doing anything the other is not. If you want a comparable rate, compare inside your own follower band and use the P25 to P75 column pair as your realistic range. The same size-versus-rate compression appears on every platform we index, and it is the reason we built per-platform calculators such as our X engagement rate calculator and our TikTok engagement rate calculator instead of publishing one universal number.
Does the 2 percent engagement benchmark exist anywhere in our data?
The 2 percent LinkedIn company page engagement benchmark exists in our data only as a rare outlier, not as a norm. Of the 21,428 measured pages in the 2026-08-27 cohort, 1,525 reach 2 percent or higher. That is 7.12 percent of pages. A looser 1 percent threshold is cleared by 3,144 pages, or 14.67 percent. Meanwhile 8,076 pages, 37.69 percent of the measured index, sit below 0.1 percent. If your page is under 0.1 percent you are in the largest single group we measured.
The only place the 2 percent figure describes the middle of a group is among pages with fewer than 1,000 followers, where the median rate is 2.3677 percent across 1,499 pages. That is the shape of the problem. A benchmark derived from a survey of marketers, or from a sample weighted toward small and highly engaged pages, produces a number that is real for pages under 1,000 followers and fictional for everyone else. We are not sourcing the 2 percent figure or attributing it to anyone in particular. We are testing whether it appears in 21,428 pages we measured ourselves, and reporting that it appears at the median only in the smallest band.
| Company size band | Pages | Engagement P25 | Median | P75 | P90 | Median reactions per post |
|---|---|---|---|---|---|---|
| 2 to 10 employees | 1,659 | 0.1813% | 0.6700% | 2.1091% | 5.4181% | 15 |
| 11 to 50 employees | 3,594 | 0.1590% | 0.4530% | 1.1711% | 2.6919% | 21 |
| 51 to 200 employees | 4,700 | 0.1061% | 0.2589% | 0.6109% | 1.3223% | 31 |
| 201 to 500 employees | 2,869 | 0.0656% | 0.1619% | 0.4023% | 0.9604% | 39 |
| 501 to 1,000 employees | 2,106 | 0.0453% | 0.1147% | 0.2844% | 0.6900% | 46 |
| 1,001 to 5,000 employees | 3,388 | 0.0314% | 0.0805% | 0.2251% | 0.5858% | 59 |
| 5,001 to 10,000 employees | 983 | 0.0216% | 0.0515% | 0.1363% | 0.3511% | 74 |
| 10,001 or more employees | 1,984 | 0.0151% | 0.0387% | 0.1064% | 0.2933% | 116 |
Sample: n = 21,283 LinkedIn company pages with at least five sampled posts, a plausible follower count and a size band, measured 2026-08-27. The incoherent "1 employee" band is excluded. Engagement rate is average reactions per post divided by follower count.
Comments are far scarcer than reactions and almost nobody publishes the ratio. Across the 20,033 pages in our 2026-08-27 cohort that carry both a reaction average and a comment average, the median page gets 17.7 reactions for every comment, with a P25 of 9.1 and a P75 of 31.0. The median comment rate is 0.0096 percent of followers, which works out to roughly one comment per 10,417 followers per post. Fully 33.25 percent of measured pages average one comment or fewer per post. If your company page gets a couple of comments on a good post, that is the normal ceiling for a page of ordinary size, not a failure of your content.
Posting activity is also thinner than the platform's reputation suggests. Of the 29,742 pages in the cohort, 12,375 had posted within the seven days to 2026-08-27, which is 41.61 percent. Within 30 days the figure is 18,842 pages, or 63.35 percent, and within 90 days it is 21,687 pages, or 72.92 percent. A further 5,508 pages, 18.52 percent of the index, had no visible post at all when we sampled them. Put together, 36.65 percent of indexed company pages had gone at least a month without posting.
Which industries earn the most followers per employee?
Staffing and Recruiting has the highest followers per employee of any industry we can measure reliably, at a median of 754.6, which is 8.7 times the all-index median of 86.4. We ranked all 346 self-declared industries in the 2026-08-27 cohort and kept only those with at least 100 pages carrying both a follower count and an associated staff count. The result is a 46.3 times spread between the top industry and the bottom one.
| Industry | Pages | Followers per employee P25 | Median | P75 | Median associated staff |
|---|---|---|---|---|---|
| Staffing and Recruiting | 317 | 208.6 | 754.6 | 2,395.3 | 47 |
| Venture Capital and Private Equity Principals | 377 | 169.8 | 337.6 | 666.5 | 32 |
| Online Audio and Video Media | 114 | 114.0 | 322.6 | 1,011.7 | 57 |
| Human Resources Services | 188 | 82.7 | 285.2 | 1,049.1 | 42 |
| Design Services | 195 | 82.4 | 172.7 | 329.4 | 45 |
| Research Services | 163 | 78.5 | 170.9 | 407.5 | 43 |
| E-Learning Providers | 136 | 75.2 | 140.9 | 356.2 | 295 |
| Book and Periodical Publishing | 141 | 43.5 | 134.2 | 449.2 | 223 |
| Hospitality | 143 | 21.0 | 38.9 | 67.2 | 237 |
| Transportation, Logistics, Supply Chain and Storage | 124 | 21.6 | 38.0 | 95.1 | 343 |
| Telecommunications | 191 | 17.3 | 33.8 | 71.3 | 1,103 |
| Retail | 455 | 14.7 | 30.9 | 78.2 | 1,253 |
| Banking | 489 | 17.5 | 30.3 | 70.7 | 1,991 |
| Insurance | 285 | 16.3 | 28.6 | 67.4 | 885 |
| Facilities Services | 109 | 10.3 | 16.3 | 30.5 | 498 |
Sample: n = 26,439 LinkedIn company pages with a follower count, an associated staff count and an industry label, measured 2026-08-27. Only industries with at least 100 qualifying pages were ranked; this table shows the top eight and the bottom seven of that ranking. Industry is self-declared by the company on its own page.
The followers-per-employee industry ranking has an obvious confound, and we tested it rather than waving it away. Look at the median associated staff column: the eight highest-ratio industries have median headcounts between 32 and 295, while the seven lowest sit between 237 and 1,991, so part of the spread is the size effect from the previous section rather than anything about audience. To separate the two, we recomputed followers per employee inside a single size band, 51 to 200 employees, and kept only industries with at least 40 pages in that band.
| Industry, 51 to 200 employees only | Pages | Median followers per employee |
|---|---|---|
| Staffing and Recruiting | 43 | 733.0 |
| Venture Capital and Private Equity Principals | 54 | 241.2 |
| Design Services | 50 | 172.9 |
| Retail Apparel and Fashion | 55 | 169.5 |
| Non-profit Organizations | 61 | 143.5 |
| Computer Games | 169 | 138.4 |
| Software Development | 666 | 126.4 |
| Technology, Information and Internet | 314 | 120.2 |
| Advertising Services | 840 | 104.8 |
| IT Services and IT Consulting | 363 | 97.1 |
| Financial Services | 326 | 94.7 |
| Construction | 43 | 74.1 |
| Accounting | 48 | 73.7 |
| Insurance | 51 | 59.8 |
Sample: n = 5,838 LinkedIn company pages in the 51 to 200 employee band with a follower count, an associated staff count and an industry label, measured 2026-08-27. Only industries with at least 40 pages in that band were ranked; 30 industries qualified and this table shows 14 of them spanning the full range.
The industry effect survives the size control. Holding headcount inside one band, the spread narrows from 46.3 times to 12.3 times but does not vanish: Staffing and Recruiting still leads at 733.0 followers per employee and Insurance still trails at 59.8. A 100-person recruiting firm and a 100-person insurance broker are not competing for the same audience and should not be held to the same follower target.
Why does the industry with the most followers have the worst engagement?
Staffing and Recruiting has the highest followers per employee in our index and the lowest engagement rate, and that pairing is the most useful thing our LinkedIn data says about follower counts. Across 265 recruiting pages with at least five sampled posts, the median engagement rate is 0.0153 percent, which is 22.2 times below Research Services at 0.3389 percent and 11.0 times below the all-index median of 0.1685 percent. The same industry that accumulates 754.6 followers per employee converts almost none of them into a reaction.
| Industry | Pages measured | Median engagement rate |
|---|---|---|
| Research Services | 138 | 0.3389% |
| Marketing Services | 252 | 0.3355% |
| Spectator Sports | 223 | 0.3339% |
| Construction | 225 | 0.3192% |
| Design Services | 153 | 0.3090% |
| Advertising Services | 1,807 | 0.3055% |
| Computer Games | 298 | 0.3048% |
| Government Administration | 309 | 0.2966% |
| Airlines and Aviation | 113 | 0.0989% |
| Banking | 470 | 0.0916% |
| Professional Services | 114 | 0.0912% |
| Telecommunications | 161 | 0.0780% |
| Book and Periodical Publishing | 115 | 0.0695% |
| Human Resources Services | 165 | 0.0507% |
| E-Learning Providers | 111 | 0.0378% |
| Staffing and Recruiting | 265 | 0.0153% |
Sample: n = 21,428 LinkedIn company pages with at least five sampled posts and a plausible follower count, measured 2026-08-27. Only industries with at least 100 qualifying pages were ranked; this table shows the eight highest and the eight lowest medians from that ranking.
The plausible explanation is composition rather than content quality, and we cannot prove it from this dataset. Recruiting and HR pages accumulate followers who are job seekers and candidates, an audience that follows to watch for openings and has no reason to react to a corporate post. Note that Human Resources Services (0.0507 percent) and E-Learning Providers (0.0378 percent) sit in the same low group, and both are also high on the followers-per-employee ranking. Three industries with the same audience dynamic land in the same place on two independent metrics. That is consistent with a job-seeker audience, but our data contains no information about who the followers are, so treat it as a pattern rather than a proven mechanism.
The operational takeaway does not depend on the explanation. Two pages with identical follower counts can differ by 22 times in the share of that audience that ever engages, and the difference tracks industry. If you are buying, valuing or reporting on a page based on its follower number alone, you are pricing a number that means something different in every vertical. We reach the same conclusion on other platforms whenever we look at audience composition instead of audience size, which is why our guide to checking whether an account has real followers leads with composition checks rather than totals.
Does an older company page compound its audience?
Older companies do have far more LinkedIn followers, and the entire advantage disappears once you divide by headcount. Across the 18,366 pages in the 2026-08-27 cohort with a plausible founded year, a follower count and an associated staff count, companies founded before 1980 have a median of 53,290 followers against 6,170 for companies founded from 2018 onward. That is an 8.6 times gap, and it looks exactly like the compounding story that gets told about early platform presence.
| Founding era | Pages | Median followers | Median associated staff | Median followers per employee |
|---|---|---|---|---|
| Before 1980 | 2,578 | 53,290 | 938 | 51.0 |
| 1980 to 1994 | 1,814 | 21,006 | 331 | 55.8 |
| 1995 to 2004 | 2,568 | 17,664 | 196 | 75.4 |
| 2005 to 2011 | 2,908 | 15,907 | 133 | 101.7 |
| 2012 to 2017 | 3,829 | 14,022 | 102 | 124.6 |
| 2018 to 2026 | 4,669 | 6,170 | 35 | 132.2 |
Sample: n = 18,366 LinkedIn company pages with a founded year between 1800 and 2026, a follower count capped at 50,000,000 and an associated staff count, measured 2026-08-27. Founded year is self-declared and present on 67.5 percent of the index.
Now read the followers-per-employee column of that LinkedIn founding-era table. Followers per employee runs in the opposite direction to raw followers: 51.0 for companies founded before 1980, rising monotonically to 132.2 for those founded from 2018 onward. Companies founded since 2018 have 2.6 times the followers per employee of pre-1980 companies while having roughly one twenty-seventh of the headcount. The apparent age advantage in raw follower counts is a headcount advantage wearing a disguise.
Name the confounds before drawing a lesson. Founding era in this data also proxies for industry mix, capital intensity and business model: pre-1980 companies in our index skew toward banking, insurance, manufacturing and retail, which are exactly the industries at the bottom of the followers-per-employee table. Founding year is also self-declared and present on only 67.5 percent of pages. What we can say is narrow and useful: across 18,366 pages measured on 2026-08-27, older pages do not show a per-head audience advantage, so "we started late" is not a satisfying explanation for a thin company page.
Does the country change what a normal company page looks like?
Geography shifts the followers-per-employee benchmark by a factor of 4.5 across the countries we can measure, from 195.8 in the United Arab Emirates to 43.5 in Poland. Getting to that number required rejecting one column and validating another. The hq_country column in our schema is filled on only 1,418 of 29,742 pages, 4.77 percent, and worse, it does not contain countries: its most common values are England, Ontario, Ile-de-France, Gujarat and London. It holds sub-national regions. We compared it against the separate country_code column on the 1,311 rows where both are present and the agreement rate was 0.00 percent, which confirmed the type mismatch rather than a data error.
The country_code column is a different story: it is filled on 24,688 of 29,742 pages, 83.01 percent, and it validates. We cross-checked it against the free-text headquarters location and found, for example, that pages coded DE resolve to Berlin, Munich, Hamburg, Duesseldorf and Cologne with no cross-country leakage in the top fifteen cities. Every geography number below uses country_code and none uses hq_country.
| Country | Pages | Median followers per employee | Median followers | Median associated staff |
|---|---|---|---|---|
| United Arab Emirates | 420 | 195.8 | 27,902 | 109 |
| Saudi Arabia | 274 | 124.9 | 83,760 | 582 |
| France | 1,078 | 113.0 | 17,450 | 119 |
| United Kingdom | 1,965 | 112.8 | 18,823 | 116 |
| Spain | 501 | 110.3 | 21,003 | 154 |
| Brazil | 555 | 109.5 | 35,094 | 326 |
| Italy | 372 | 104.5 | 20,641 | 174 |
| India | 1,656 | 98.2 | 30,004 | 227 |
| Singapore | 257 | 96.7 | 26,618 | 180 |
| United States | 6,600 | 90.9 | 21,674 | 205 |
| Netherlands | 524 | 79.4 | 9,325 | 88 |
| Australia | 685 | 75.4 | 14,673 | 136 |
| Germany | 720 | 73.5 | 8,323 | 104 |
| Sweden | 495 | 73.4 | 11,793 | 145 |
| Canada | 880 | 73.0 | 17,325 | 191 |
| Finland | 224 | 47.3 | 3,967 | 72 |
| Poland | 211 | 43.5 | 3,997 | 80 |
Sample: n = 24,688 LinkedIn company pages with a resolved country code, a follower count and an associated staff count, measured 2026-08-27. Only countries with at least 200 qualifying pages are shown; 20 countries qualified and this table shows 17 of them.
Two honest qualifications go with that table. First, our index is not a random sample of world business: of the 24,688 geo-resolved pages, 6,952 are United States pages, which is 28.16 percent, followed by the United Kingdom at 8.92 percent and India at 7.26 percent. Countries outside that Anglosphere and Western European core are represented by hundreds of pages, not thousands, so read the smaller rows as directional. Second, country here is where the company page says it is headquartered, not where its followers live, and the two are very different things for a multinational.
How many B2B companies actually expose a reachable email?
Exactly half of the B2B companies we tried to enrich yielded no contact detail at all from their own public website. We attempted contact discovery on 28,032 of the 29,742 indexed companies, specifically those that publish a website domain and where the enrichment pipeline actually ran. Of those 28,032, we found nothing for 14,003, which is 49.95 percent. This is the base rate that every claim about B2B list coverage should be measured against, and it is measured on companies chosen by our crawler rather than by a vendor trying to make a coverage number look good.
The ladder below narrows from any contact down to the thing outreach teams actually want, which is a working email attached to a named human with a job title. Each row is a count of distinct companies over the same denominator of 28,032, so the percentages are directly comparable. No email address, phone number, person name or company identifier appears anywhere in this article: these are counts only.
| What we found on the company website | Companies | Share of the 28,032 attempted |
|---|---|---|
| Any contact at all, email or phone | 14,029 | 50.05% |
| Any email address | 11,166 | 39.83% |
| Any email whose domain passes an MX check | 10,437 | 37.23% |
| Any email that is not a role inbox | 6,340 | 22.62% |
| Any email with a person name attached | 2,674 | 9.54% |
| Any email with both a person name and a job title | 597 | 2.13% |
| Only a role inbox, no individual address | 4,826 | 17.22% |
| A phone number but no email | 2,863 | 10.21% |
| Nothing at all | 14,003 | 49.95% |
Sample: n = 28,032 LinkedIn-indexed companies that publish a website domain and where our enrichment pipeline ran, measured from the PlayerSells LinkedIn index frozen at 2026-08-27 01:00 UTC. Counts are distinct companies, not contact rows.
The 2.13 percent row is the number to remember. Out of 28,032 companies with a live website, 597 exposed an email address that we could tie to both a named person and that person's job title from public sources. If a list vendor tells you they have decision-maker contacts for most of a market, the public web is not where those contacts came from, because on the public web the base rate is one company in forty-seven. That is not a claim that better sources do not exist. It is a measurement of what is freely visible, and it is the floor any coverage claim should be compared against.
Failure has a shape too. Of the 28,032 companies we attempted, 4,201 (14.99 percent) had a website that did not respond at all when our crawler tried it, and 8,803 (31.40 percent) had a live, reachable site with nothing extractable on it. The pipeline marked 15,020 companies (53.58 percent) as having found something, and the frozen contact table resolves to 14,029 companies holding at least one usable record. Where email addresses do exist, 92.71 percent of the 38,700 collected addresses pass an MX lookup on their domain, and 30.23 percent are role inboxes rather than individual addresses.
How the address was found predicts whether it is valid. Addresses lifted from an explicit mailto link pass MX at 93.6 percent across 32,177 rows, while addresses pattern-matched out of page text pass at 88.7 percent across 6,618 rows. Text-scraped addresses therefore fail an MX check 1.77 times as often, 11.3 percent against 6.4 percent. One methodological warning that matters if you build this yourself: our 42,579 phone records all carry an MX flag of false and a role-account flag of true, because phone numbers have no MX record and the role flag is set unconditionally for phones. Neither is a quality signal, and reporting either as one would manufacture a finding out of a schema artifact.
| Company size band | Companies attempted | Any email found | Non-role email found | Phone found | Nothing found |
|---|---|---|---|---|---|
| 2 to 10 employees | 3,395 | 46.6% | 21.9% | 25.2% | 48.7% |
| 11 to 50 employees | 5,366 | 50.1% | 24.0% | 36.3% | 41.9% |
| 51 to 200 employees | 5,939 | 44.8% | 22.8% | 36.2% | 45.4% |
| 201 to 500 employees | 3,445 | 38.5% | 23.6% | 36.3% | 49.3% |
| 501 to 1,000 employees | 2,406 | 35.2% | 23.2% | 36.5% | 51.2% |
| 1,001 to 5,000 employees | 3,731 | 30.7% | 23.0% | 36.0% | 54.9% |
| 5,001 to 10,000 employees | 1,081 | 26.7% | 21.9% | 30.2% | 61.3% |
| 10,001 or more employees | 2,219 | 21.3% | 17.8% | 26.0% | 66.8% |
Sample: n = 27,582 LinkedIn-indexed companies with a website domain, a completed enrichment attempt and a size band, measured 2026-08-27. The incoherent "1 employee" band, 386 companies, is excluded. Percentages are the share of companies in that band, so the columns overlap and do not sum to 100.
Contact discovery gets harder as companies get bigger, which is the opposite of what most list-building assumptions expect. Email discovery falls from 50.1 percent in the 11 to 50 employee band to 21.3 percent in the 10,001 or more band, and the share where we found nothing at all rises from 41.9 percent to 66.8 percent. The non-role share stays roughly flat across the whole range, from 17.8 percent to 24.0 percent, which tells you the failure is in discovery rather than in the mix of what gets discovered. Enterprises replace published addresses with contact forms. The accounts most outbound teams want are the ones the public web covers worst, and anyone budgeting an outbound programme against a flat coverage assumption is budgeting wrong. Our write-up on using a social account for cold outreach and lead generation covers the channel alternatives when direct email coverage is this thin.
What LinkedIn actually shows you about the people at a company
Public LinkedIn people data is a fixed-size shop window of roughly five profiles per company, not a roster, and that single fact explains most of what looks strange about B2B people data. Our index holds 275,435 people rows attached to 28,873 company pages as of 2026-08-27. Only 27,087 of those rows, 9.83 percent, carry a job title at all. The four columns that would make a person row useful for segmentation are structurally empty in the public data we can see: location, education, headline and profile photo are 100 percent NULL across all 275,435 rows, so no claim in this article touches any of them.
| Company size band | Companies | Median people indexed | Median associated staff | Median coverage of headcount |
|---|---|---|---|---|
| 2 to 10 employees | 2,997 | 4 | 7 | 50.00% |
| 11 to 50 employees | 5,395 | 5 | 27 | 22.58% |
| 51 to 200 employees | 6,067 | 6 | 102 | 6.85% |
| 201 to 500 employees | 3,505 | 6 | 284 | 2.60% |
| 501 to 1,000 employees | 2,463 | 7 | 590 | 1.26% |
| 1,001 to 5,000 employees | 3,838 | 6 | 1,487 | 0.48% |
| 5,001 to 10,000 employees | 1,095 | 5 | 3,879 | 0.17% |
| 10,001 or more employees | 2,258 | 5 | 10,577 | 0.05% |
Sample: n = 27,618 LinkedIn company pages that have at least one associated person row, an associated staff count and a size band, measured 2026-08-27. The incoherent "1 employee" band, 270 pages, is excluded. Coverage is people rows we hold divided by the associated member count LinkedIn shows on the page.
In that LinkedIn people coverage table, the median people indexed column barely moves while the median associated staff column beside it moves by three orders of magnitude. A company with seven associated members surfaces a median of four people publicly, and a company with 10,577 surfaces a median of five. Coverage therefore collapses from 50.00 percent to 0.05 percent. A 274,000-row people table sounds like a lead database and behaves like a directory of whoever each company happens to feature.
A roughly five-profile shop window predicts exactly the seniority skew we measure in LinkedIn people data. Of the 27,087 people rows with a resolvable title on 2026-08-27, 9,042 are C-level (33.38 percent), 5,398 are director (19.93 percent), 4,200 are manager (15.51 percent), 3,129 are VP (11.55 percent), 2,835 are individual staff (10.47 percent) and 2,483 are founders (9.17 percent). C-level, VP and founder together are 14,654 rows, 54.10 percent of everyone with a title. No real organisation has a majority of its titled staff at VP level or above. What we are seeing is not an org chart, it is the small set of profiles a company page tends to surface, weighted toward whoever is most visible.
The practical reading is that B2B people counts should never be treated as headcount, and any per-person metric derived from them inherits the same bias. If you are sizing a market from public LinkedIn people data, you are sizing the shop window. Our audience finder tool takes the opposite approach and works from audience overlap rather than from scraped rosters, for the same reason.
Which other platforms do B2B companies actually maintain?
Instagram, not X, is the second most linked social platform on B2B company websites in our index, appearing on 12,559 company sites against 9,294 for X. We collected 59,971 outbound social links from the websites of the companies we indexed, covering 18,551 distinct companies that link to at least one social profile. The ranking below counts distinct companies, so a company linking three Instagram accounts still counts once.
| Platform linked from the company website | Companies | Matched into our own directories |
|---|---|---|
| LinkedIn, the company's own page | 15,345 | 0 |
| 12,559 | 0 | |
| 11,091 | 0 | |
| X | 9,294 | 6,857 |
| YouTube | 8,439 | 77 |
| TikTok | 2,515 | 2,448 |
| GitHub | 448 | 0 |
| Bluesky | 283 | 273 |
| Telegram | 205 | 159 |
Sample: n = 18,551 companies with at least one social profile link discovered on their website, from 59,971 total link rows, measured from the PlayerSells LinkedIn index frozen at 2026-08-27 01:00 UTC. The match column counts links we could resolve against our own X, TikTok, Bluesky and Telegram directories.
The median company in that set maintains two non-LinkedIn platforms. Of the 18,551 companies with any social link, 1,810 (9.76 percent) link only to LinkedIn, 3,347 link to one other platform, 4,199 to two, 4,724 to three and 4,471 to four or more. The long-standing assumption that B2B lives on LinkedIn and X, and that Instagram is a consumer channel, does not survive contact with 18,551 company websites: 3,265 more companies link an Instagram profile than link an X profile. You can browse the accounts behind those links in our X accounts directory and our TikTok accounts directory.
Company pages are also less standalone than they look. Of the 2,303 companies in the 10,001 or more employee band, 1,476 (64.1 percent) declare at least one affiliated LinkedIn page, against 152 of 3,813 (4.0 percent) in the 2 to 10 employee band. Large-company follower counts are therefore split across a page family, and a single page understates the group's total reach at the top of the market while representing it fairly at the bottom. Across the whole index, 8,000 pages declare an affiliated page and LinkedIn's similar-pages module points from 29,852 indexed pages at 102,618 distinct destination companies, which is 3.45 times more companies than we currently hold.
What this data cannot tell you
Our LinkedIn dataset is a five-day cross-section, which means it cannot measure growth, and we are not going to pretend otherwise. Our snapshot table holds 30,201 captures of LinkedIn company pages, but 28,148 of 29,238 distinct pages have exactly one snapshot. Only 1,090 pages have two or more, with a median span of 2.65 days, and the pages that got re-fetched were selected by our crawler's own retry logic rather than at random. A follower growth rate computed over 2.65 days on a self-selected 3.7 percent subset would be noise presented as a benchmark, so this article contains no growth, trend or velocity claim about LinkedIn. Where we do have long snapshot series we publish them, for example in our study of what six million daily snapshots show about shrinking accounts.
The index is also not a random sample of the world's companies. Our crawler expands through LinkedIn's own similar-pages graph, which means it follows the platform's notion of relatedness, and the geographic result is visible in the numbers: 28.16 percent of geo-resolved pages are United States companies. Companies that maintain an active, well-filled LinkedIn page are more likely to enter the index than companies that do not, so the dormancy figure of 18.52 percent with no visible post is, if anything, a floor rather than a ceiling for LinkedIn as a whole.
Three columns are unusable and we are naming them rather than quietly working around them. The hq_country column is filled on 4.77 percent of pages and contains regions and cities rather than countries, so every geography number in this article uses country_code instead. In the people table, location, education, headline and photo are 100 percent NULL across 275,435 rows, so no person-level geography or seniority-by-region cut is possible. And the associated staff count that every followers-per-employee figure divides by is LinkedIn's count of members who list the company as their employer, not payroll headcount, which will overstate size for companies with many alumni-style stale profiles and understate it for companies whose staff are not on LinkedIn.
Engagement is measured on a sample of up to ten recent posts per page, not on a page's full history. That makes it a recent-activity measure, sensitive to whether a page happened to publish an unusually strong or weak run in the weeks before 2026-08-27. We also checked the far tail: 8 of 21,428 measured pages show an arithmetically impossible engagement rate above 100 percent, most likely a stale follower count paired with a viral post. Because every figure we publish is a median or a percentile no higher than P90, those 8 rows move nothing, but you should know they exist.
Finally, everything here is association, not causation. Pages in Staffing and Recruiting also tend to have low engagement rates. Companies that fill in more specialties also tend to be larger. Companies founded recently also tend to be small and to sit in technology industries. We can tell you what tends to travel with what across 29,742 pages measured in one week of August 2026. We cannot tell you that changing one of those things would change the other.
Questions and answers about LinkedIn company page benchmarks
What is a good LinkedIn company page engagement rate in 2026?
Judge it inside your follower band, because the median engagement rate falls 171.6 times from the smallest pages to the largest. Across 21,428 company pages we measured on 2026-08-27, the median is 2.3677 percent under 1,000 followers, 0.7884 percent from 1,000 to 4,999, 0.1720 percent from 10,000 to 49,999, and 0.0138 percent above 500,000 followers. Beating the median for your own band is a meaningful result. Comparing yourself to an all-industry average is not.
How many followers should my company page have?
The median LinkedIn company page in our 29,742-page index has 15,487 followers, but that figure is useless without your headcount. Inside a size band, the median is 1,056 followers for companies with 2 to 10 employees, 11,220 for 51 to 200, 72,900 for 1,001 to 5,000 and 318,261 for companies with 10,001 or more. A better single test is followers per employee, where the all-index median is 86.4 and the P25 to P75 range is 38.0 to 195.5.
Is the 2 percent LinkedIn engagement benchmark real?
The 2 percent LinkedIn engagement benchmark is real for very small pages and fictional for everyone else. Of the 21,428 company pages we measured on 2026-08-27, 1,525 reach 2 percent or higher, which is 7.12 percent of pages, and 37.69 percent sit below 0.1 percent. The 2 percent figure sits above our 90th percentile of 1.4550 percent. The only group whose median clears it is pages with fewer than 1,000 followers, where the median is 2.3677 percent across 1,499 pages.
What is followers per employee and how do I calculate it?
Followers per employee is your LinkedIn follower count divided by the number of associated members LinkedIn shows on your page, and it is the fairest way to compare pages of different sizes. Across 26,439 pages measured on 2026-08-27 the median is 86.4. It falls with company size, from a median of 164.5 in the 2 to 10 employee band to 33.9 in the 10,001 or more band, so compare against your own band rather than the overall figure.
Do older companies have better LinkedIn pages?
Older companies have more followers and fewer followers per employee. Across 18,366 pages with a founded year, companies founded before 1980 have a median of 53,290 followers against 6,170 for companies founded from 2018 onward, an 8.6 times gap. Per employee the order reverses: 51.0 for pre-1980 companies against 132.2 for 2018 onward. Founding era also proxies for industry and capital intensity, so this is an association rather than proof that page age does nothing.
What share of B2B companies publish a reachable email address?
Fewer than four in ten. Of 28,032 indexed companies with a live website where our enrichment ran, 11,166 (39.83 percent) exposed any email address and 10,437 (37.23 percent) exposed one whose domain passes an MX check. Only 6,340 (22.62 percent) exposed an address that is not a role inbox, and just 597 (2.13 percent) exposed an address tied to both a named person and a job title. Half of all attempted companies, 14,003 of 28,032, yielded nothing at all.
Why do big companies have worse contact coverage than small ones?
Because enterprises replace published addresses with contact forms. In our 2026-08-27 measurement, email discovery falls from 50.1 percent of companies in the 11 to 50 employee band to 21.3 percent in the 10,001 or more band, while the share where nothing at all was found rises from 41.9 percent to 66.8 percent. The share of discovered emails that are individual rather than role addresses stays roughly flat at 17.8 to 24.0 percent, so the failure is in discovery, not in the type of address available.
Can I trust the number of employees LinkedIn shows on a company page?
Treat it as a LinkedIn membership count, not a headcount. The figure counts members who list that company as their employer, so it drifts high where stale profiles accumulate and low where staff are not on the platform. It is filled on 94.2 percent of our 29,742-page index with a median of 141 and no zero values, so it is usable as a scale variable. Every followers-per-employee figure in this article divides by it and inherits that caveat.
How many LinkedIn company pages are actually still posting?
Fewer than half posted in the week we measured. Of the 29,742 pages in our 2026-08-27 index, 12,375 (41.61 percent) had posted within seven days, 18,842 (63.35 percent) within 30 days and 21,687 (72.92 percent) within 90 days. A further 5,508 pages, 18.52 percent of the index, had no visible post at all. Combined, 36.65 percent of indexed company pages had gone at least a month without publishing.
Does filling in the specialties field help a company page grow?
Not in any way we can measure. Across the 26,439 pages with both follower and staff counts, median followers rise from 10,643 for pages with no specialties listed to 25,786 for pages listing 20 or more, but median associated staff rise from 95 to 247 over the same range. Followers per employee stays flat between 80.8 and 90.3 across every specialty bucket. Listing more specialties travels with being a bigger company, not with a better normalised audience.
What to do with these numbers this week
Start with one division of your own LinkedIn numbers. Take your LinkedIn follower count, divide it by the associated member count shown on your own page, and compare the result to the median for your size band in this article: 164.5 for 2 to 10 employees, 130.8 for 11 to 50, 112.2 for 51 to 200, 89.1 for 201 to 500, 74.9 for 501 to 1,000, 54.3 for 1,001 to 5,000, 43.7 for 5,001 to 10,000 and 33.9 for 10,001 or more. That one number tells you more about your page than any follower total, and it takes thirty seconds.
Then run the same check on your LinkedIn engagement rate, inside your follower band rather than against a global average. If your page is between 10,000 and 49,999 followers, your realistic range is the P25 to P75 of 0.0876 percent to 0.3312 percent, with a median of 0.1720 percent, measured across 6,485 pages. Anything at or above 0.5933 percent puts you in the top tenth of pages your size. Chasing a 2 percent target at that size is chasing a number that 92.88 percent of measured pages never reach.
If your work involves buying, valuing or auditing social accounts rather than running a company page, the same discipline applies across platforms: divide before you compare, use medians rather than averages, and check the composition of an audience before you price its size. Our percentile tools do that arithmetic against our own indexes, including the X follower percentile rank checker, and the full set is listed on the free tools hub. Fresh cuts of our directory data are published on the insights hub as we measure them.
If you are on the buying or selling side of social accounts, the ratios in this article are the same ones we apply to listings: audience per unit of size, engagement inside a comparable band, and composition before totals. You can see how that plays out on live inventory in the PlayerSells marketplace, and the mechanics of a protected transaction are set out on our how escrow works page. Every figure in this article came from our own LinkedIn index of 29,742 company pages, frozen at 2026-08-27 01:00 UTC, and we will republish these benchmarks as the index deepens.
Free tools for this topic

Published by the PlayerSells editorial team. Data comes from PlayerSells marketplace records and our own crawlers. About PlayerSells · Editorial policy
Related Articles
Continue learning with these related guides.
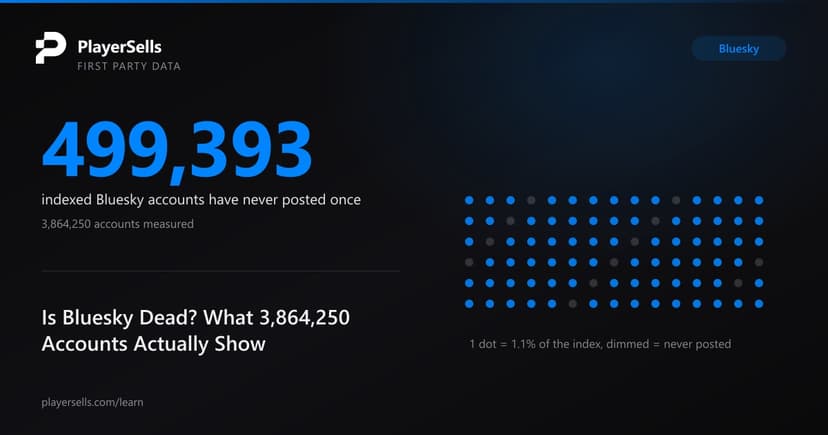
Is Bluesky Dead? What 3,864,250 Accounts Actually Show
Is Bluesky dead? We measured 3,864,250 indexed accounts: 12.9 percent have never posted, and the 29,114 we track daily grew 1.18 percent in 79 days.
How Fast Do TikTok Accounts Actually Grow? 9,559 Measured
We measured 9,559 TikTok accounts over 64 days: 64.47 percent grew, the median gained 3.63 percent, and the average overstated that by 125 times.

Telegram Channel Benchmarks 2026: View Rates, Size, and Growth from 2.4 Million Channels
Telegram view rate benchmarks from 2.4 million indexed channels: 31.3% median at 1K-5K subscribers, 3.3% above 500K, plus 52-day growth by category.