Does Twitch Account Age Still Matter? We Measured 432,192
Across 432,192 Twitch channels read on 2026-09-08, account age is almost pure accumulation, and at a matched follower count the newer channel wins.

Twitch account age buys almost nothing that the calendar would not have handed over anyway. Across the 432,192 Twitch channels in our directory that carry both a creation date and a follower count, read on 2026-09-08, the median channel has gained between 25.6 and 38.8 followers per year of existence, and that number barely moves across thirteen consecutive creation cohorts. The 2013 cohort holds a median 514 followers against 32 for the 2025 cohort, a 16.1x raw gap. Divide each by the years the cohort has existed and the gap collapses to 1.4x. Age is not a property of a channel. It is a stopwatch.
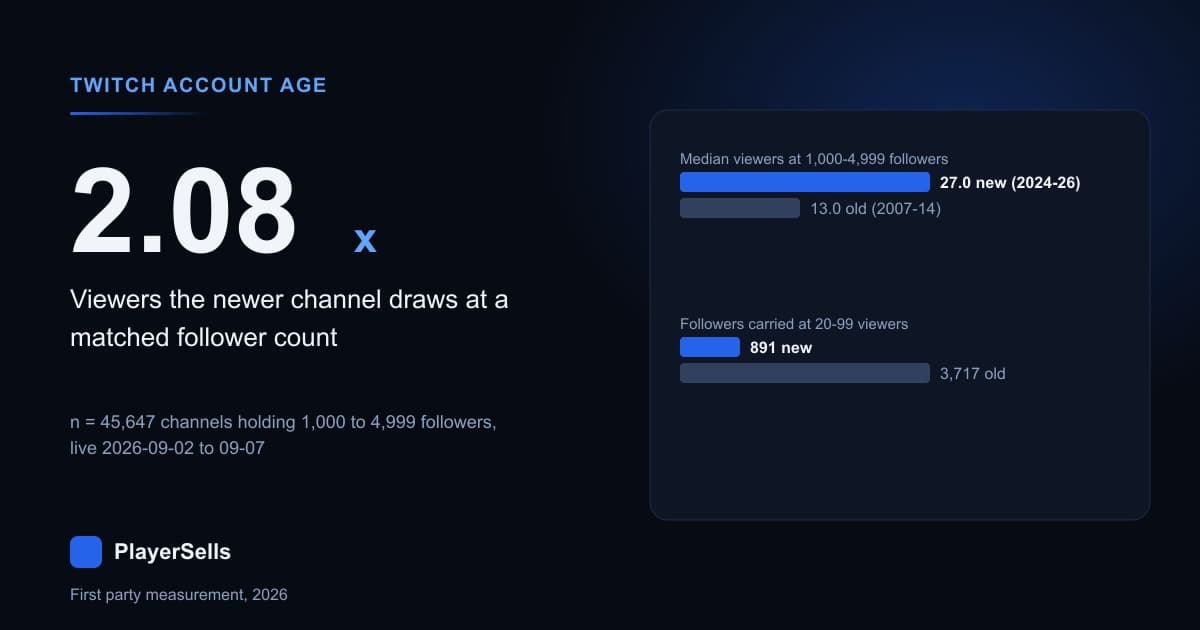
The second result is the one that should move a price. Hold follower count fixed and the older channel performs worse, not better. Among the 45,647 channels holding 1,000 to 4,999 followers that our crawl caught live in that window, the 2007 to 2014 cohorts ran a median 13.0 concurrent viewers across the six full UTC days from 2026-09-02 to 2026-09-07, while the 2024 to 2026 cohorts ran 27.0 on the same follower count. That is 2.08x the live audience, in favour of the newer account. We reproduced it from raw live samples on a single day and got 13.23 against 28.58.
We sell aged accounts, so this is an awkward finding to publish. It is also the one the data supports, and a buyer who reads it will price a channel more accurately than one taking a creation year at face value. Below is the cohort census, the matched-size test that reverses it, and the checks we ran on our own crawler.
What does our Twitch directory actually contain?
Our Twitch engine started writing on 2026-09-01 and held 434,476 channel rows when we ran the queries behind this article on 2026-09-08. Of those, 432,192 carry both an account creation timestamp and a follower count, with creation dates spanning 2007-05-22 to 2026-09-08. Live statistics are aggregated per channel per UTC day; 2026-09-01 and 2026-09-08 are partial days, so every activity figure here uses the six complete days from 2026-09-02 to 2026-09-07. That leaves 360,935 channels with usable per-day viewer data.
One property of this dataset governs everything else. Channels enter the directory because the crawl finds them broadcasting, and 430,532 of the 432,192 dated channels, 99.6%, last broadcast on or after 2026-09-01. This is a census of Twitch channels that streamed in the past eight days, not a census of Twitch accounts. Dormant 2014 channels are largely absent from it. Any comparison below is therefore a comparison between old channels that are still working and new channels that are still working.
Do older Twitch channels have more followers?
Yes, by a wide margin, and the margin is uninteresting on its own. The table below gives the follower distribution by creation-year cohort across all 432,192 dated channels, measured 2026-09-08. The last column is the piece that matters: each channel's follower count divided by its own age in years, then the median of those per-channel ratios.
| Creation cohort | Channels | Median followers | P90 followers | Median followers per year of existence |
|---|---|---|---|---|
| 2007 to 2011 | 4,856 | 828 | 55,804 | 52.8 |
| 2012 | 7,077 | 654 | 33,870 | 46.2 |
| 2013 | 13,850 | 514 | 15,784 | 38.8 |
| 2014 | 19,300 | 397 | 8,888 | 32.6 |
| 2015 | 24,343 | 368 | 8,598 | 32.8 |
| 2016 | 23,574 | 370 | 7,995 | 36.2 |
| 2017 | 27,112 | 312 | 6,210 | 34.0 |
| 2018 | 35,451 | 251 | 4,674 | 30.5 |
| 2019 | 29,442 | 221 | 3,643 | 30.7 |
| 2020 | 52,007 | 190 | 3,351 | 30.7 |
| 2021 | 35,782 | 154 | 2,436 | 29.4 |
| 2022 | 29,162 | 112 | 1,962 | 26.8 |
| 2023 | 27,595 | 82 | 1,512 | 25.6 |
| 2024 | 30,355 | 58 | 1,174 | 26.6 |
| 2025 | 33,196 | 32 | 625 | 27.7 |
| 2026 | 39,090 | 5 | 128 | 38.1 |
The raw fall is steep but it is not clean. Median followers rise from 368 in the 2015 cohort to 370 in 2016, and in the ungrouped run the 2009 cohort sits at 748 against 888 for 2010. Anyone describing this curve as a monotonic decline has not looked at the middle of it. The concentration is real enough on its own terms: the 2007 to 2014 cohorts are 10.4% of the 432,192 channels and hold 38.2% of all followers in the directory.
Is the age gap a premium, or just accumulation?
Accumulation, for the entire middle of the distribution. From the 2013 cohort to the 2025 cohort, median followers fall 16.1x, from 514 to 32. Median followers per year of existence over the same thirteen cohorts moves from 38.8 to 27.7, a 1.4x spread, and the ordering inside it is not clean: 2016 sits at 36.2, above both 2014 at 32.6 and 2015 at 32.8. A residual tilt toward the older cohorts remains, and survivorship explains it at least as well as any age effect does, since the old channels in this directory are the ones that never stopped.
We measured the per-year figure two ways before trusting it, taking the median of per-channel ratios and separately dividing each cohort's median follower count by its mean age in years. The two agree within 1.5% on every cohort from 2008 to 2025.
Two rows deserve an asterisk rather than a citation. The 2007 to 2011 group reaches 52.8 followers per year on only 4,856 channels, every one of which is still broadcasting in 2026, a survivor set fifteen years deep. The 2026 cohort reads 38.1 because its denominator is a mean age of 0.25 years. Strip both ends and the working answer is that a Twitch channel accumulates roughly 26 to 39 followers per year of existence regardless of when it was created.
What happens when you match old and new channels on follower count?
The ranking reverses. We took every channel holding 1,000 to 4,999 followers that our crawl recorded live across the six full days from 2026-09-02 to 2026-09-07: 45,647 of the 55,736 channels sitting in that follower band, the rest having gone unseen in the window. The match is tight: median follower count stays between 1,695 and 2,145 in every cohort, so these channels really are the same size on paper.
| Creation year | Channels | Median followers | Median concurrent viewers | Viewers per 1,000 followers | Median hours on air, 6 days |
|---|---|---|---|---|---|
| 2009 | 113 | 2,000 | 12.00 | 6.67 | 4.75 |
| 2011 | 506 | 2,011 | 12.00 | 6.22 | 4.25 |
| 2013 | 2,399 | 1,910 | 12.75 | 6.51 | 4.00 |
| 2015 | 3,691 | 1,811 | 13.00 | 7.09 | 4.00 |
| 2017 | 3,848 | 1,808 | 14.00 | 7.35 | 3.75 |
| 2019 | 3,612 | 1,830 | 15.00 | 8.17 | 3.50 |
| 2021 | 3,936 | 1,803 | 16.00 | 8.74 | 3.50 |
| 2023 | 2,164 | 1,738 | 20.50 | 11.45 | 3.75 |
| 2024 | 1,909 | 1,730 | 24.00 | 12.71 | 3.50 |
| 2025 | 1,389 | 1,695 | 30.00 | 16.92 | 3.50 |
| 2026 | 526 | 1,956 | 43.08 | 21.11 | 3.00 |
Read the third and fourth columns together. A 2009 channel with 2,000 followers pulled 12.0 concurrent viewers in that window while a 2025 channel with 1,695 followers pulled 30.0, and the 2009 channel was on air longer, 4.75 hours against 3.50 across the six days. Hours on air is our own count rather than a platform figure: each sample we catch of a live channel stands for fifteen minutes, so the column is a floor on real airtime. More work, fewer viewers, the same number on the profile page. That is not a rounding difference; it holds across every follower band we cut.
Here is the honest limit on that comparison. Matching on follower count is matching on a consequence of both age and growth rate, so a 2025 channel at 2,000 followers got there in months and is by definition growing fast right now, while a 2011 channel at 2,000 followers took fourteen years and is by definition not. The comparison is real, and it is exactly the choice in front of a buyer looking at two listings of the same size. It is not evidence that age causes decay, and we are not claiming that.
How many live viewers does a thousand followers buy?
Fewer, the older the account. Dividing each channel's concurrent viewers by its own follower count turns the pattern into one number a buyer can apply directly. The table covers 237,011 channels with 50 or more followers and live data in the 2026-09-02 to 2026-09-07 window, grouped into five follower bands and five creation cohorts. The smallest cell holds 435 channels and the largest holds 28,356.
| Follower band | Channels in band | 2007 to 2014 | 2015 to 2018 | 2019 to 2021 | 2022 to 2023 | 2024 to 2026 |
|---|---|---|---|---|---|---|
| 50 to 199 | 76,367 | 25.28 | 25.97 | 27.03 | 27.52 | 38.58 |
| 200 to 999 | 86,726 | 11.76 | 12.45 | 13.16 | 15.28 | 23.03 |
| 1,000 to 4,999 | 45,647 | 6.61 | 7.31 | 8.44 | 10.50 | 14.59 |
| 5,000 to 24,999 | 17,686 | 4.03 | 4.80 | 6.11 | 8.23 | 10.77 |
| 25,000 and above | 10,585 | 2.25 | 2.86 | 3.78 | 5.97 | 6.34 |
Every row is monotone, and the penalty widens as channels get larger. In the 50 to 199 band the newest cohort converts followers to live viewers 1.53x better than the oldest; in the 25,000 and above band it is 2.82x. The general decay of conversion with size is the well-known part, and we have written elsewhere about how follower count and concurrent viewers come apart on Twitch and Kick. The cohort spread inside each band is the new part.
How many followers does the same live audience carry?
Turn the question around and the finding becomes a valuation rule. Instead of matching on followers, match on live audience and ask how many followers each cohort is carrying to produce it. The table below covers the 343,096 channels that had live data in our six-day window and averaged at least one concurrent viewer.
| Concurrent viewer band | Channels | 2007 to 2014 | 2015 to 2018 | 2019 to 2021 | 2022 to 2023 | 2024 to 2026 |
|---|---|---|---|---|---|---|
| 1 to 4 viewers | 194,185 | 159 | 109 | 63 | 37 | 11 |
| 5 to 19 viewers | 94,609 | 648 | 517 | 423 | 336 | 159 |
| 20 to 99 viewers | 37,873 | 3,717 | 3,065 | 2,361 | 1,728 | 891 |
| 100 or more viewers | 16,429 | 62,200 | 32,233 | 19,126 | 13,356 | 2,356 |
At 20 to 99 concurrent viewers, the median 2007 to 2014 channel carries 3,717 followers and the median 2024 to 2026 channel carries 891, a 4.17x difference for the same live audience. The bottom row reads 26.4x, and we would not build a price on it: a 2025 channel already pulling 100 viewers is a rocket, and the cell holds only 2,434 of them. Use the 20 to 99 row. It is the plain-language version of the whole article, which is that on an old channel a follower is a weaker promise.
Is the older channel still gaining followers?
Barely, at matched size. Our engine captures end-of-day follower counts opportunistically rather than for every channel, so paired observations exist for 8,201 channels out of 434,476 and skew heavily toward large ones. Working inside that limit, we took every channel with a first and last paired reading at least five days apart and a starting count between 20,000 and 100,000 followers, which leaves 3,077 channels with a mean span of 6.0 days.
| Creation cohort | Channels | Median starting followers | Median follower growth per 7 days | Share gaining | Share losing |
|---|---|---|---|---|---|
| 2007 to 2014 | 873 | 52,370 | 0.023% | 67.1% | 31.0% |
| 2015 to 2018 | 1,202 | 51,125 | 0.049% | 72.5% | 25.6% |
| 2019 to 2021 | 639 | 48,491 | 0.114% | 82.8% | 16.1% |
| 2022 to 2026 | 363 | 47,119 | 0.262% | 81.3% | 14.0% |
Starting size is matched within 11% across the four groups and the median weekly growth rate still differs by 11.4x. The share column is the blunter read: 31.0% of the 873 oldest channels lost followers over the week against 14.0% of the 363 newest. One week is a short window and this subset is not representative of small channels, so treat the direction as measured and the magnitude as provisional. Our Twitch follower rank tool places a follower count against the full directory.
Could this be our crawler rather than Twitch?
The obvious way to fake this result is a discovery bias that only finds new channels when they are already popular. If our crawl walked a top-N shelf per category, the newest cohorts would arrive pre-selected for viewers and their medians would be inflated. The data says the opposite happened.
| Creation cohort | Channels with live data | Share under 1 concurrent viewer | Share under 3 concurrent viewers |
|---|---|---|---|
| 2007 to 2014 | 38,498 | 2.4% | 28.4% |
| 2015 to 2018 | 92,388 | 2.7% | 33.0% |
| 2019 to 2021 | 97,190 | 4.0% | 40.1% |
| 2022 to 2023 | 47,191 | 5.8% | 47.7% |
| 2024 to 2026 | 85,668 | 9.1% | 59.1% |
Newer cohorts contain far more near-empty streams, not fewer: 9.1% of the 85,668 channels created since 2024 averaged under one concurrent viewer, against 2.4% of the 38,498 created before 2015. A shelf crawl cannot produce that ordering, because a shelf would have filtered those empty new channels out before they ever reached the directory. The crawl behaves instead like a broad enumeration of whatever is live at sampling time, recording between 112,652 and 126,948 distinct channels on each of the six full days.
Three further checks point the same way. Restricting the 1,000 to 4,999 band to channels live on five or six of the six days, 4,230 channels averaging 18.5 to 21.75 hours on air, the gradient survives at 16.60 median viewers for the oldest group against 32.08 for the newest. Recomputing from raw live samples on 2026-09-05 alone, a different table and a different aggregation, returns 13.23 against 28.58 in that band. Language mix does not track the pattern either: English share runs 69.4%, 60.7%, 57.2%, 57.7% and 64.0% across the five cohort groups, which is not monotone while every viewer column is.
What we could not measure
Cohort survival is the biggest gap, and it is structural. Because channels enter our directory by being caught live, we have no denominator of every Twitch account created in 2015, so we cannot say what share of any cohort has gone dark. Nobody should read the shrinking old cohorts in the first table as a death rate; they are the shape of who is still streaming, filtered through eight days of crawling.
Kick cannot be tested at all. Our Kick directory held 199,711 channels on 2026-09-08 and carries no account creation column of any kind, so the same analysis is impossible there. That is worth knowing before you pay a premium for an aged Kick channel: on Kick, the age claim is a seller's statement rather than something a buyer can check against public data the way a Twitch creation date can be. What that directory can confirm is size and category, never a birthday.
Two more limits. Everything here is cross-sectional and eight days deep at most, so it supports association and not causation. And this article makes no price claims, because sale prices for Twitch channels are not in the dataset we queried; for the pricing side, see what we have published on how much a Twitch or Kick channel is worth.
What should a buyer or seller actually do with this?
Decide what you are buying first, because the two answers point in opposite directions. If you want a live audience next month, the creation year is close to worthless as a signal and the follower count on an old channel systematically overstates what will show up: 13.0 median concurrent viewers against 27.0 for a new channel at the same 1,000 to 4,999 followers. Buy on recent concurrent viewers and recent hours, which is what our Twitch channels with viewers category asks a listing to evidence, on the rare occasion a Twitch channel is listed at all: the marketplace held 435 active listings on 2026-09-08 and none of them were Twitch.
If you want the follower base itself, as a name, a category position, or a standing audience to reactivate, the old channel is the cheaper unit: 3,717 followers against 891 for the same 20 to 99 concurrent viewers. That is a real asset with a real discount attached, as long as you price it as a dormant list rather than as a live audience. Our Twitch channel value estimator works from both inputs rather than from age.
Sellers should read the same tables in reverse. Leading a listing with a 2012 creation date is leading with the weakest number you have, since the buyer can see that per year of existence your channel is inside the same 26 to 39 follower band as everyone else. Lead with the last month of concurrent viewers, hours on air, and category. If you are listing now, the seller flow asks for those figures for exactly this reason, and comparable channels are visible in our public Twitch directory.
One cross-platform caution. This is a Twitch result and it does not transfer automatically. On X the age question has a different structure, since the constraints there are handle history and account standing rather than live viewership, which we covered in our analysis of aged X accounts and follower count. An aged X account and an aged Twitch channel are two different assets sharing an adjective, and the aged versus new account comparison sets out what differs.
What else do people ask about Twitch account age?
The questions below come up repeatedly from buyers and from sellers writing a first listing. Each answer is tied to a query we ran against our own Twitch directory on 2026-09-08 rather than to industry convention, and each carries the sample size it rests on.
Does an older Twitch account get more viewers?
In absolute terms yes, because it has more followers. At matched follower count, no. Among the 45,647 channels holding 1,000 to 4,999 followers that we caught live, the 2007 to 2014 cohorts ran a median 13.0 concurrent viewers over 2026-09-02 to 2026-09-07 while the 2024 to 2026 cohorts ran 27.0. The older channels were also on air longer, a median 4.25 hours against 3.50 over those six days.
How many followers does a Twitch channel gain per year?
The median channel gains roughly 26 to 39 followers per year of existence, and that band holds across every creation cohort from 2013 to 2025 in our sample of 432,192 dated channels. The 2013 cohort sits at 38.8 and the 2025 cohort at 27.7. This is a median across all channels in the directory, so it is dragged down by the very large number of channels that stream occasionally and grow slowly.
Is a 2012 Twitch account worth more than a 2024 one?
Only through the followers it accumulated, and our data gives no measured age premium beyond that. A 2012 channel carries a median 654 followers against 58 for a 2024 channel, measured across 7,077 and 30,355 channels respectively. Per year of existence the two sit at 46.2 and 26.6, and at matched follower size the 2024 channel delivers more live viewers. Price the audience, not the birthday.
Does Twitch account age affect the algorithm?
We cannot measure Twitch ranking, so we will not claim anything about it. What we can measure is the outcome a viewer-facing ranking would produce, and it does not favour old accounts: across all five follower bands in our 237,011-channel comparison, channels created since 2024 pull between 1.53x and 2.82x more concurrent viewers per 1,000 followers than channels created before 2015.
What is a good concurrent viewer count for a channel with 2,000 followers?
In the 1,000 to 4,999 follower band, measured on the 45,647 channels we caught live over 2026-09-02 to 2026-09-07, the quartiles for the oldest cohorts run 6.0 at P25, 13.0 at the median and 26.0 at P75. For channels created since 2024 the same quartiles are 12.0, 27.0 and 59.0. The pooled median for the band, all cohorts together, is 15.5 concurrent viewers.
Can a buyer verify a Twitch channel's creation date?
On Twitch, yes. Creation timestamps are part of the public channel data our engine collects, and we hold a creation date and a follower count for 432,192 of the 434,476 channels in the directory, with creation dates running from 2007-05-22 to 2026-09-08. That makes the creation year one of the few claims in a Twitch listing that a buyer can check independently before paying. It is verifiable; the tables above are the argument for why it is also not worth much.
Does any of this apply to Kick?
Not yet, and not from our data. The 199,711 Kick channels we held on 2026-09-08 carry no creation date field at all, so we cannot repeat a single test in this article on Kick. Treat aged-Kick claims accordingly and buy on measurable things instead: follower count, category and recent viewership, all of which our Kick crawl does record and a serious listing should evidence.
Related Articles
Continue learning with these related guides.
X Bookmark Rate Benchmarks From 94,318 Scored Accounts
Half the X accounts we scored on ten or more posts bookmark under 0.0273% of their views, and a third of original posts get no bookmarks at all.
Where X Posts Come From: 617,398 Posts by Source Label
We read the source label on 617,398 X posts from 12,000 accounts: 89.66% came from an app X ships, and 7.48% from third-party publishing software.