How Much Is a Twitch or Kick Channel Worth in 2026?
We measured 107,014 Twitch and 64,621 Kick channels: the top 1% hold 64% of all viewer-hours, and we have sold zero streaming channels so far.

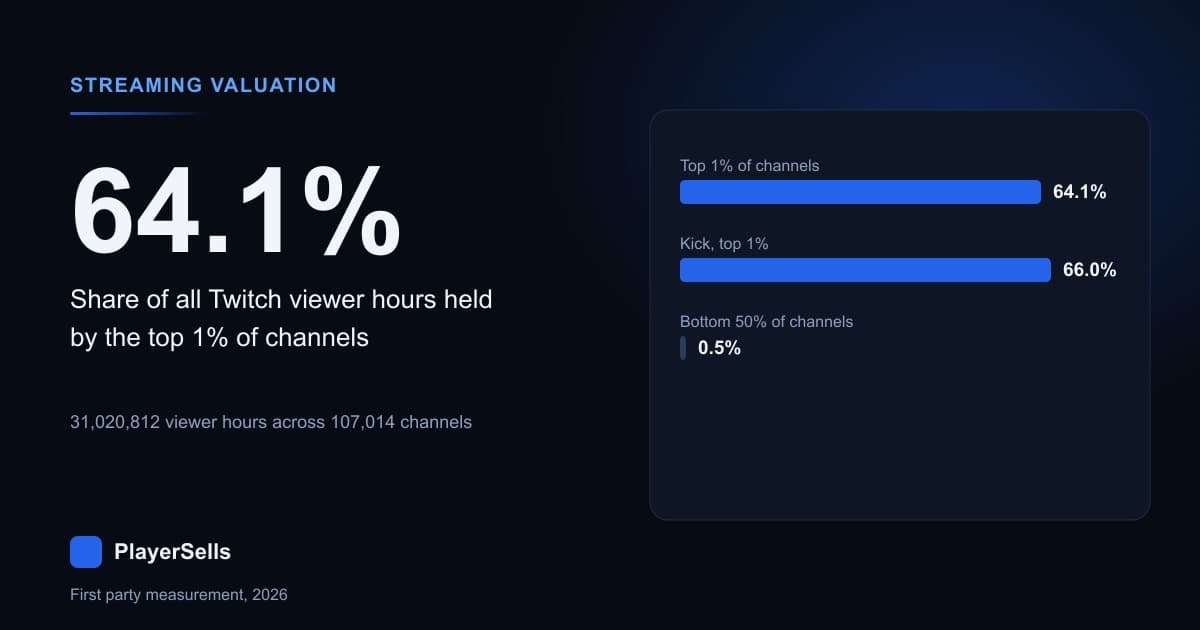
The value of a live channel sits in viewer-hours, and viewer-hours are concentrated to a degree that breaks most pricing rules. Across the 107,014 Twitch channels our directory recorded streaming between 2026-09-01 and 2026-09-02, the top 1% captured 64.1% of the 31,020,812 viewer-hours we measured, while the bottom half of channels captured 0.5%. On Kick we measured 21,808,161 viewer-hours across 64,621 channels, and the top 1% took 66.0% of them. Any 2026 price attached to a Twitch or Kick channel has to start there.
Now the part most valuation articles skip. PlayerSells opened Twitch and Kick channels for sale on 2026-09-02. Our marketplace database holds 691 listings and 196 completed deals, and exactly zero of them are Twitch or Kick. There is no median streaming sale price on this site yet, so we are not going to print one. What follows is a pricing method built from what we do measure: 126,581 Twitch channels, 77,838 Kick channels, and 196 real transactions on the platforms where we already have a history.
Why does the same audience carry 8.5x more followers on Twitch?
Take the channels averaging at least 1,000 concurrent viewers across our two-day sampling window. On Twitch there are 1,058 of them and the median one holds 252,901 followers, with a middle half running from 98,961 to 629,361. On Kick there are 682, and among the 669 carrying a follower count the median is 29,572. The delivered audience is nearly identical: the Twitch group's median channel produced 6,041 viewer-hours per measured day, the Kick group's produced 5,563. The follower numbers differ by 8.5x for the same viewers.
That ratio kills per-follower pricing on a live platform. A follower is a lifetime counter that keeps incrementing long after a channel stops drawing anyone. A concurrent viewer is rent, re-earned every stream. The gap is not a top-tier quirk either: at 100 to 249 average viewers the median Twitch channel carries 15,228 followers against Kick's 1,876, a factor of 8.1, while those two tiers delivered 390 and 392 viewer-hours per measured day.
The table below matches channels by what they deliver rather than by what they claim, drawn from the Twitch channel directory and Kick channel directory we crawl ourselves.
| Average concurrent viewers | Twitch median followers | Kick median followers | Twitch viewer-hours per day | Kick viewer-hours per day |
|---|---|---|---|---|
| 1 to 4 | 56 | 22 | 2.0 | 2.1 |
| 5 to 9 | 284 | 185 | 10.9 | 10.3 |
| 10 to 24 | 838 | 546 | 29.5 | 34.0 |
| 25 to 49 | 2,216 | 1,187 | 78.5 | 90.9 |
| 50 to 99 | 5,367 | 1,467 | 163.0 | 185.0 |
| 100 to 249 | 15,228 | 1,876 | 389.9 | 392.2 |
| 250 to 999 | 55,612 | 5,377 | 1,230.4 | 1,107.3 |
| 1,000 or more | 252,901 | 29,572 | 6,041.0 | 5,563.3 |
One coverage note, because it decides which rows above can be trusted. Kick's follower field is populated on 41,721 of the 64,621 channels with measured viewership, since the live-directory endpoint sometimes returns a channel object without it. Coverage is uneven: 52.7% in the 1 to 4 viewer band, 73.8% at 5 to 9, then 98.1% to 100% in every band from 10 viewers upward. The comparison here rests on the well-covered bands, so treat the two smallest Kick rows as indicative. Missing rows are excluded rather than counted as zero, which would invent channels with no audience.
What does each viewer tier actually deliver?
A viewer-hour here is average concurrent viewers multiplied by hours on air, computed from our own 15-minute sweeps of both platforms. It is a derived quantity rather than a separately observed one: summing average CCV times airtime across Twitch gives 31,025,319 against a stored total of 31,020,812, a difference of 0.015%. Airtime and audience are already multiplied together in it, so a channel that rarely goes live scores low no matter how large its follower count.
One naming trap has to be flagged before any of these figures is used in a price. The engine columns are labelled for a 30-day window they do not yet cover, because both crawlers started on 2026-09-01. The proof is in the data: the largest airtime value in the entire Twitch table is 25.5 hours and the 99th percentile is 13.8, which is a two-day total and not a monthly one. Every per-day figure in this article therefore divides each channel's recorded total by the number of days that channel was actually rolled up, and nothing here should be read as a monthly average.
Sorting the 107,014 measured Twitch channels into viewer tiers turns the distribution into a valuation grid. The share of channels in each tier and the share of total viewer-hours they hold move in opposite directions, which is the whole reason a linear price per viewer is wrong.
| Average concurrent viewers | Twitch channels | Share of measured channels | Median viewer-hours per day | Share of all viewer-hours |
|---|---|---|---|---|
| 1 to 4 | 52,825 | 49.4% | 2.0 | 0.71% |
| 5 to 9 | 17,952 | 16.8% | 10.9 | 0.95% |
| 10 to 24 | 15,672 | 14.6% | 29.5 | 2.29% |
| 25 to 49 | 7,186 | 6.7% | 78.5 | 2.74% |
| 50 to 99 | 5,111 | 4.8% | 163.0 | 4.31% |
| 100 to 249 | 4,317 | 4.0% | 389.9 | 9.04% |
| 250 to 999 | 2,893 | 2.7% | 1,230.4 | 20.92% |
| 1,000 or more | 1,058 | 1.0% | 6,041.0 | 59.04% |
Read the two end rows against each other. Half of all measured Twitch channels sit in the 1 to 4 viewer band and together account for 0.71% of the viewer-hours we recorded. The 1,058 channels at 1,000 viewers or more are 1.0% of the sample and account for 59.04%. The median channel in the top band delivered 3,020x the viewer-hours of the median channel in the bottom one. A price ladder that moves linearly with viewers has already mispriced both ends.
Why is 1% of channels holding two thirds of the value?
Because a viewer-hour is the product of two things that compound together at the top: a bigger audience and more airtime. Ranking all 107,014 measured Twitch channels by recorded viewer-hours, the top 1% held 64.11%, the top 5% held 86.93% and the top 10% held 93.16%. Kick is sharper still, at 65.95%, 88.72% and 95.52% across its 64,621 channels.
That result had an obvious way to be fake, so we tested it. Large channels are live more often, so they appear on more of our two measured days, which would inflate their raw totals. Re-running the same concentration on a per-measured-day rate instead of a raw sum, the Twitch top 1% still held 60.83% and the top 10% held 91.80%; on Kick, 63.31% and 94.77%. The concentration survives the correction with about three points shaved off it, so it is the platform's shape and not our crawler's.
Two limits belong on this section. The daily rollups cover 2026-09-01 to 2026-09-02 and nothing else, which is enough for a cross-sectional statement about who holds the audience and not enough for any growth, retention or churn claim. We make none here. Second, a channel enters the sample only if it was live during one of our sweeps, so these figures describe channels that actually streamed in that window, not every registered account.
Can a small channel even be monetised?
This question separates a channel with an audience from a channel with a business, and it is directly measurable. Twitch publishes a broadcaster type on every channel and it is populated on all 126,581 rows in our crawl: 13,171 partners, 66,797 affiliates and 47,149 with neither. Among the channels we actually recorded streaming, that status tracks viewership hard.
| Average concurrent viewers | Channels | Partner | Affiliate | Neither | Neither, share |
|---|---|---|---|---|---|
| 1 to 4 | 52,825 | 87 | 19,972 | 32,766 | 62.0% |
| 5 to 9 | 17,952 | 152 | 14,794 | 3,006 | 16.7% |
| 10 to 24 | 15,672 | 585 | 14,089 | 998 | 6.4% |
| 25 to 49 | 7,186 | 1,412 | 5,420 | 354 | 4.9% |
| 50 to 99 | 5,111 | 2,740 | 2,214 | 157 | 3.1% |
| 100 to 249 | 4,317 | 3,240 | 845 | 232 | 5.4% |
| 250 to 999 | 2,893 | 2,340 | 360 | 193 | 6.7% |
| 1,000 or more | 1,058 | 944 | 56 | 58 | 5.5% |
The top row is the buying lesson. Of the 52,825 Twitch channels averaging 1 to 4 concurrent viewers, 32,766 carry no partner or affiliate status, so they cannot take a subscription today, and only 87 of them are partners. By 1,000 viewers, 89.2% are partners. A small channel priced as though it earns is being priced on a capability that 62.0% of its peer group does not have, and a buyer can verify that in seconds before paying.
Kick answers the same question through a different field. Among its 64,621 measured channels, subscriptions are enabled on 55.0% of those averaging 1 to 4 viewers and on 94.6% of those above 1,000, while verification runs from 1.4% to 89.9% across the same span. Neither badge is a price by itself, but both gate whether the earnings model behind our Twitch money calculator applies to a specific channel or is describing something it cannot do yet.
What does our own marketplace prove about asking prices?
Our transaction record corrected an assumption we started with. The received wisdom is that asking prices overshoot and deals close at a discount. Measured across 196 completed deals in our marketplace database, the median deal closed at exactly 100% of the listed price: the median ratio of realised price to asking price is 1.000, and 155 of the 196 closed at or above the listed figure.
Two filters had to be applied before publishing that, because a listing row carries its current price rather than the price on the day of the deal. Restricting to the 138 completed deals where the listing was created before the deal closed, 88 landed exactly at asking, 38 below and 12 above. Restricting further to the 22 deals where the listing was never edited after the close, 16 landed at asking, 6 below and zero above. Deals that appear to close above asking are an editing artifact rather than a premium.
| Sample of completed deals | Deals | Closed below asking | Closed at or above asking | Median realised over asking |
|---|---|---|---|---|
| All completed deals with both prices | 196 | 41 | 155 | 1.000 |
| Listing created before the deal closed | 138 | 38 | 100 | 1.000 |
| Listing never edited after the close | 22 | 6 | 16 | 1.000 |
Asking prices do overshoot, then, but not at the negotiating table. They overshoot by never finding a buyer. Counting only listings that reached the public site, 141 of 638 have sold, or 22.1%, and on X specifically 129 of 502, or 25.7%. The penalty for an ambitious ask is a listing that sits, which is a slower and more expensive failure than a discount. Our measured guide to what an X account should cost covers the follower-platform version of the same trade.
How fast does price per 1,000 audience fall?
Streaming has no transaction record on this site, but the shape of audience pricing transfers, and it is measurable on the platforms that do have one. Sampled from every listing that reached the public site and from every completed deal with a stated audience, the median price per 1,000 followers or members falls steeply as the audience grows.
| Audience size | Listings | Median asking price per 1,000 | Completed deals | Median realised price per 1,000 |
|---|---|---|---|---|
| Under 1,000 | 139 | $333.33 | 33 | $149.73 |
| 1,000 to 9,999 | 269 | $24.49 | 140 | $65.16 |
| 10,000 to 49,999 | 130 | $13.22 | 20 | $11.73 |
| 50,000 to 249,999 | 71 | $9.23 | 2 | Not published, n too small |
| 250,000 or more | 23 | $7.89 | 0 | No completed deals |
The asking curve falls 42x from the smallest band to the largest across 632 listings. The realised curve falls 12.8x across the three bands where at least 20 deals closed, from $149.73 to $11.73 per 1,000. Below 20 deals we publish nothing: the 50,000 to 249,999 band holds two completed transactions and the band above it holds none, and a median of two numbers is not a benchmark. The asking and realised columns come from different populations, every listing versus only the ones that sold, so read each column down and not across.
The transferable rule is decreasing returns. Price per unit of audience falls hard as total audience rises, on every platform where we hold real transactions. Any streaming price rule that multiplies concurrent viewers by a fixed dollar figure will overprice large channels and underprice small ones, in the same direction and for the same reason.
What we cannot yet tell you about streaming prices
Being specific about the gaps beats filling them with estimates. As of 2026-09-02 our marketplace holds zero Twitch, Kick or YouTube listings out of 691 in total, split across X with 548, TikTok with 99, Telegram with 41 and Instagram with 3. The listing schema carries an average-viewers field for exactly this purpose and it is populated on 0 rows, because no streaming channel has been listed yet.
So there is no median Twitch sale price, no median Kick sale price, no dollars-per-concurrent-viewer figure and no listing-to-sale time for streaming that we can honestly quote. We also hold no retention data on a bought channel, since our streaming engines are two days old. When somebody publishes an average Twitch channel sale price, ask what the denominator is. Usually it is a set of asking prices on a broker site, and our own record says the asking price is the number that fails to clear roughly three times in four.
The Twitch channel value calculator and the Kick channel value calculator do exist, and they take a different route: each models the channel as an earning asset, an income multiple plus the standing audience behind it, with every rate band printed on the page as an assumption. That is an estimate with its inputs shown, not a transaction price, and both tools say so on their own results.
How should you price a streaming channel today?
Six steps, each anchored to a measurement above rather than to a rule of thumb. First, start from measured average concurrent viewers over a stated window and never from followers, since the same delivered audience carries 8.5x more followers on Twitch than on Kick. Second, convert that to viewer-hours per day, because it is the sellable inventory and it already contains how often the channel actually goes live.
Third, verify monetisation status before pricing any earnings, given that 62.0% of Twitch channels averaging 1 to 4 viewers are neither partner nor affiliate. Fourth, respect the concentration: 1.0% of measured Twitch channels hold 59.04% of the viewer-hours, so a mid-tier channel is a different asset class from a top-tier one and not a smaller slice of it. Fifth, apply a declining price per unit of audience, which is what our transaction record does on every platform that has one.
Sixth, price the ask to clear. Since the median completed deal in our marketplace closes at exactly the listed price, the asking price is effectively the final price, and the risk of setting it high is not a haggle but a listing that never moves. Anyone preparing to list a channel for sale should let that single fact shape the number more than any multiple does.
What actually changes hands when a channel sells?
Neither platform publishes an owner-to-owner transfer flow, so delivery on both is a credential handover of the account itself. Ownership is proved first, the same way it is on every platform we support: the seller writes a one-time code into the one piece of profile text only the owner can edit, the channel description, and we read that text back from the platform directly instead of trusting a screenshot.
The consequences are the ones that apply to any credential-delivered account: recovery email control, linked-account cleanup, and the cooldown windows each platform enforces after a change of hands. Our platform-by-platform transfer rules reference covers those windows in detail. Live inventory appears on the Twitch channels for sale and Kick channels for sale pages as sellers start using them.
Common questions about Twitch and Kick channel value
How much is a Twitch channel worth?
There is no honest single number, and we will not invent one: our marketplace has completed zero Twitch transactions as of 2026-09-02. What we can state is what drives the price. The median measured Twitch channel in the 1,000-plus viewer band delivered 6,041 viewer-hours per measured day against 2.0 for the median channel in the 1 to 4 band, and that 3,020x spread in delivered audience is what a price has to track.
Do followers matter when buying a Twitch or Kick channel?
Far less than the number sellers quote suggests. Across the 1,058 Twitch and 682 Kick channels averaging 1,000-plus concurrent viewers, median follower counts were 252,901 and 29,572 for almost identical daily viewer-hours. A follower count is a lifetime total that never falls with inactivity, so on a live platform it measures history rather than current reach, and paying per follower means paying for that history twice.
What is a viewer-hour, and why price on it?
A viewer-hour is one person watching for one hour: average concurrent viewers multiplied by hours on air. We compute it from our own 15-minute sweeps, and it is the unit every stream revenue source is paid against, from subscriptions to sponsorship. It also folds in consistency automatically, because a channel that rarely goes live produces few viewer-hours no matter how large its follower count looks.
Is a Kick channel worth more than a Twitch channel with the same followers?
On delivered audience, usually yes, and by a wide margin. In our crawl the median Kick channel at 100 to 249 average viewers carries 1,876 followers where the equivalent Twitch channel carries 15,228, so matching two channels on followers pits a large Kick audience against a much smaller Twitch one. Compare measured viewership instead, then check monetisation status on each channel separately.
Why will you not publish an average streaming sale price?
Because we have not sold one. Our database holds 691 listings and 196 completed deals across X, TikTok, Telegram and Instagram, and zero across Twitch, Kick or YouTube. Deriving a streaming median from follower-platform sales would be a guess wearing a decimal point. Once streaming deals close here, the figure gets published with its sample size, the way every other number on this page is.
How do I check a channel's real viewership before I pay?
Look it up in a directory that samples viewership independently of the seller. We sweep both platforms every 15 minutes and publish per-channel results, so a claimed audience can be checked against a measured one. Note that a channel absent from a sweep window shows no measurement rather than zero viewers, which is a reason to ask for more history and not a red flag by itself.
Does a partner or affiliate badge change what a channel is worth?
It changes what the channel can earn, which sits upstream of price. Across all 126,581 Twitch channels in our crawl, 13,171 are partners and 47,149 hold neither status. In the 1 to 4 viewer band, 62.0% hold neither, so a small channel usually cannot take subscriptions at all until it qualifies. Price the capability a channel has today, not the one it might reach later.
Related Articles
Continue learning with these related guides.
Does Twitch Account Age Still Matter? We Measured 432,192
Across 432,192 Twitch channels read on 2026-09-08, account age is almost pure accumulation, and at a matched follower count the newer channel wins.
X Bookmark Rate Benchmarks From 94,318 Scored Accounts
Half the X accounts we scored on ten or more posts bookmark under 0.0273% of their views, and a third of original posts get no bookmarks at all.