
X Bookmark Rate Benchmarks From 94,318 Scored Accounts
Half the X accounts we scored on ten or more posts bookmark under 0.0273% of their views, and a third of original posts get no bookmarks at all.

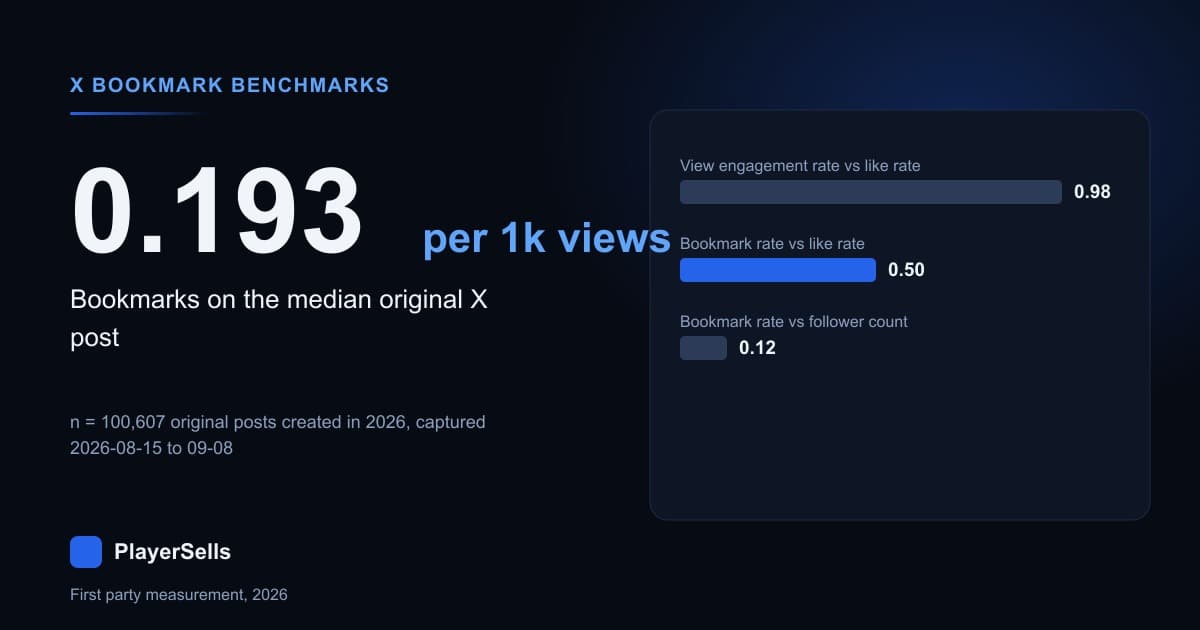
The median original post on X collects 0.193 bookmarks per 1,000 impressions, and 33.50% of original posts collect no bookmarks at all. Both numbers come from a 3% block sample of our own X post capture: 100,607 original posts created in 2026, captured between 2026-08-15 and 2026-09-08. At the account level, across the 94,318 X accounts our engagement scorer had rated when we pulled the table on 2026-09-08, the median bookmark rate is 0.0308% of views. Those are the headline figures. Most of this article is about why they are so easy to misread.
Here is the blunt answer to the title. Among the 54,559 scored accounts with at least ten original posts in the sample, half sit below a 0.0273% bookmark rate, three quarters below 0.0928%, and only 1,332 accounts reach 1.00% or higher. An account bookmarking above 0.30% of its views sits in the top tenth of everything we scored. We measured that on our own directory, in a 30 day window, on 2026-09-08, and we are not aware of a published distribution to check it against. So treat it as our number, not the platform's.
What is a good bookmark rate on X?
The percentile ladder below is the benchmark. It covers the 54,559 accounts in our scoring table with at least ten original posts sampled, which is the depth at which the number stops jumping around. Thinner accounts sit inside the wider 94,318 figure but produce noisier rates, and the section on sample depth quantifies that.
| Percentile | Bookmark rate (% of views) | Accounts at or above |
|---|---|---|
| 25th | 0.0000 | about 40,900 |
| 50th (median) | 0.0273 | 27,280 |
| 75th | 0.0928 | 13,640 |
| 90th | 0.3018 | 5,456 |
| 95th | 0.6195 | 2,728 |
| 99th | 1.5002 | 546 |
Read that ladder as impressions, not followers. A 0.0273% rate means roughly one bookmark for every 3,663 views on the account's median post. The equivalent like rate on the same posts is far larger. Across 54,570 accounts pulled from the same table later that day, the median of the per-account median bookmark counts was 3, against 72 for likes and 7,823 for views. Bookmarks are a small counter, and small counters are where the interesting variance hides.
One composition check belongs with that ladder. Just over half the cohort, 28,321 of 54,677 accounts, has a sampled timeline where more than a tenth of the posts are retweets. Bookmarks survive that better than most counters, because the rate divides two medians taken over the same original posts and every retweet row carries a bookmark count of zero. It still moves the number: restrict the cohort to accounts posting no more than 10% retweets, 26,356 of them, and the median falls to 0.0199% and the 90th percentile to 0.2699%. The ladder above describes the whole scored population, and that is its cleanest slice.
What is our bookmark rate actually a rate of?
Before publishing anything derived, we reproduced it. Our stored bookmark rate equals the median bookmark count on the account's sampled original posts, divided by the median view count on those same posts, times 100. On the 49,206 accounts where the number of sampled originals was odd, so the median lands on a real post, our formula reproduced the stored value exactly on 49,205 of them. That is 99.998%.
On the 45,112 accounts with an even number of sampled originals the exact match rate drops to 66.68%, because the true median falls between two posts while the stored column is an integer. Two rival formulas failed: bookmarks over follower count matched 26,855 of 94,318 rows, and mean bookmarks over mean views matched 20,531. Parity of the originals count predicted the match while parity of the total tweet count did not, which tells us the medians are taken over original posts only.
One consequence matters more than the rest. Our engagement column equals likes plus retweets plus replies plus quotes on 106,908 of 106,908 sampled originals, with bookmarks excluded. Every engagement rate computed from those four counters, including the one our X engagement rate calculator produces, ignores the save button completely.
How many posts get no bookmarks at all?
A third of them. Of 100,607 original posts created in 2026 in our 3% sample, 33,706 had a bookmark count of zero, which is 33.50%. An independent 2% sample drawn with a different seed returned 33.53% on 68,046 posts, so the figure is stable. The 25th percentile post has zero bookmarks, the median has 2, the 75th percentile has 23, the 90th has 154, and the 99th has 2,848. The mean is 145.14, which is why nobody should quote a mean here.
One trap deserves naming, because our own brief nearly walked into it. The bookmark count column has no nulls, which reads as fully populated. It is not fully measured. Every retweet row carries zero: the maximum bookmark count across 55,749 sampled retweets was 0, and across an independent 36,441 retweets it was also 0. Retweets were 29.5% of the sample, so pooling them would drag the whole-table median to zero. Everything here excludes them.
Why do the pooled and median bookmark ratios disagree?
Compare bookmarks to likes and you get two different answers depending on how you pool. Summed across our 100,607 posts, 14,602,210 bookmarks against 165,577,199 likes gives a pooled ratio of 0.0882, or about one bookmark for every 11 likes. Take the ratio inside each post and then the median, and you get 0.0282, about one bookmark for every 35 likes. The independent second sample returned 0.0850 and 0.0280 for the same two statistics, so the 3.1x gap is real.
The gap is not the concentration artifact we first assumed. The top view decile holds 77.60% of all bookmarks and 75.74% of all likes, barely a difference. What happens instead is that the bookmark to like ratio climbs steadily with reach: posts that travel are saved at a higher rate relative to how much they are liked. That is a narrower claim than the one about what a viral tweet actually proves, and a more useful one. The decile cut below came from a later pull of the same 3% sample, by then holding 100,687 originals, so its row counts do not sum to the 100,607 above.
| View decile | Median views | Pooled bookmarks per like | Median bookmarks per like | Median bookmarks per 1,000 views |
|---|---|---|---|---|
| 1 (n=10,069) | 253 | 0.0328 | 0.0000 | 0.000 |
| 2 (n=10,069) | 1,053 | 0.0434 | 0.0000 | 0.000 |
| 3 (n=10,069) | 2,374 | 0.0575 | 0.0000 | 0.000 |
| 4 (n=10,069) | 4,250 | 0.0639 | 0.0144 | 0.198 |
| 5 (n=10,069) | 7,694 | 0.0698 | 0.0317 | 0.211 |
| 6 (n=10,069) | 13,280 | 0.0736 | 0.0385 | 0.250 |
| 7 (n=10,069) | 22,942 | 0.0757 | 0.0441 | 0.302 |
| 8 (n=10,068) | 41,326 | 0.0752 | 0.0420 | 0.359 |
| 9 (n=10,068) | 87,820 | 0.0879 | 0.0459 | 0.454 |
| 10 (n=10,068) | 363,240 | 0.0904 | 0.0576 | 0.496 |
From the bottom decile to the top, the pooled ratio rises 2.76x and bookmarks per 1,000 views rise from effectively zero to 0.496. Only 563 of the 93,341 originals with at least one like, or 0.60%, ended up with more bookmarks than likes. A post that outbookmarks its own likes is genuinely rare.
Does bookmark rate rise or fall with follower count?
Neither, cleanly. The table below cuts our scored accounts by the follower count recorded at scoring time. The rate peaks in the 78,305 to 99,999 window at 0.0363% and falls to 0.0214% above a million followers, which is a 1.7x spread across four orders of magnitude of audience size. That is a much flatter relationship than most engagement metrics show.
| Follower window | Accounts | Observed range | Median rate | 75th | 90th | Median post has zero bookmarks |
|---|---|---|---|---|---|---|
| Just under 1,000 | 4,247 | 993 to 999 | 0.0000 | 0.0542 | 0.1865 | 63.6% |
| Just under 10,000 | 11,073 | 1,001 to 9,999 | 0.0225 | 0.1312 | 0.3918 | 47.2% |
| 78k to 100k | 15,128 | 78,305 to 99,999 | 0.0363 | 0.1137 | 0.3506 | 29.9% |
| 100k to 500k | 11,921 | 100,000 to 499,951 | 0.0314 | 0.0980 | 0.3470 | 21.1% |
| 500k to 1M | 6,532 | 500,093 to 999,125 | 0.0262 | 0.0714 | 0.2094 | 18.4% |
| Above 1M | 5,658 | 1,000,130 and up | 0.0214 | 0.0507 | 0.1178 | 15.0% |
The observed ranges are not typos. Our scoring queue holds no accounts at all between 10,000 and 78,305 followers yet. A 1% block sample of the underlying directory returned 199,967 accounts including 4,693 in the 20,000 to 50,000 band, so the hole is our crawl order, not the platform.
The scorer walks downward. The lowest follower count it had reached in the 50,000 to 1,000,000 region fell from 99,657 on 2026-08-19 to 78,305 on 2026-09-08, roughly 1,000 followers a day. Until that gap closes, nobody should read a mid-size row into this table.
Raw counts move with size even though the rate does not. On a second pull covering 54,570 accounts, the median account's median post carried 0 bookmarks in the sub-1,000 window, then 1, 2, 5, 6 and 9 as the windows climb to a million and above. Median likes over the same six windows were 10, 27, 67, 133, 171 and 284, so the bookmark to like ratio stays between 0.030 and 0.038 the whole way up. Anyone reading a large account's numbers in our public directory of X accounts should expect more bookmarks in absolute terms and about the same ratio.
Is the bookmark rate just the like rate in disguise?
No, and this is the single most useful thing we measured. Across 54,559 scored accounts we ranked four metrics and correlated the ranks. The view engagement rate correlates with the plain like rate over views at a Spearman rho of 0.9808, which means the standard engagement rate is very nearly a restatement of how much an account gets liked. The bookmark rate correlates with that same like rate at only 0.5023, and with the view engagement rate at 0.4880.
Put plainly: about half of the ranking information in an account's bookmark rate is not present in its engagement rate. It is also close to independent of audience size, with a rho of 0.1209 against follower count, while the like rate runs slightly negative at -0.1687. For anyone reading a seller's stats before buying, that makes bookmarks the one public counter that is not a rewrite of the like column. Feed a handful of an account's posts through our tweet analyzer and the bookmark line is the one carrying new information.
Which posts get saved instead of liked?
Cross-sectionally, post shape moves the ratio a long way. The table below covers originals created in 2026 with at least one recorded view. Media raises everything. Links depress everything except, apparently, the bookmark to like ratio.
| Post shape | Posts | Bookmarks per 1,000 views | Likes per 1,000 views | Bookmarks per like | Zero bookmarks | Median views |
|---|---|---|---|---|---|---|
| No media, no link | 18,207 | 0.083 | 7.744 | 0.0115 | 40.93% | 8,974 |
| No media, has link | 14,819 | 0.000 | 1.357 | 0.0189 | 51.87% | 4,744 |
| Has media, no link | 52,734 | 0.358 | 11.728 | 0.0347 | 24.59% | 14,322 |
| Has media and link | 14,843 | 0.152 | 3.781 | 0.0390 | 37.70% | 7,876 |
Length behaves differently, and more interestingly. The bookmark to like ratio is U shaped across character count, dipping to 0.0244 in the 200 to 279 character band and rising to 0.0729 for posts of 1,500 characters or more. That top band also has the lowest share of posts with no bookmarks at all, 19.55% against 38.59% in the dip. Long posts are the shape most likely to be saved.
| Characters | Posts | Bookmarks per 1,000 views | Likes per 1,000 views | Bookmarks per like | Zero bookmarks |
|---|---|---|---|---|---|
| Under 50 | 16,217 | 0.343 | 14.902 | 0.0325 | 29.14% |
| 50 to 119 | 29,813 | 0.202 | 7.942 | 0.0286 | 31.66% |
| 120 to 199 | 23,256 | 0.148 | 4.882 | 0.0263 | 36.26% |
| 200 to 279 | 13,697 | 0.147 | 5.030 | 0.0244 | 38.59% |
| 280 to 599 | 13,383 | 0.180 | 5.871 | 0.0263 | 35.37% |
| 600 to 1,499 | 3,388 | 0.284 | 6.965 | 0.0357 | 27.13% |
| 1,500 and up | 849 | 0.494 | 7.079 | 0.0729 | 19.55% |
A recognisable class of post sits underneath those tables. Of 73,077 originals with at least ten likes, the 18,952 whose bookmarks reached 10% of their likes pulled a median 27,913 views against 18,393 for the other 54,125. Their median like count was 182 against 193, essentially identical, while their median bookmark count was 41 against 4. The saved class gets more reach and the same likes.
Do links actually make a post more saveable?
We thought so for about an hour, then tested it properly and the finding died. A cross-sectional comparison of link and non-link posts mixes up which accounts post links with what a link does. The within-account test fixes that: take every account with at least three link originals and at least three link-free originals in the same period, compute each account's own median for both, and look at the difference.
| Within-account test | Accounts | Median change in bookmarks per 1,000 views | Higher / lower | Median change in likes per 1,000 views | Higher / lower |
|---|---|---|---|---|---|
| Link posts vs link-free posts | 3,636 | 0.0000 | 1,123 / 1,762 | -1.8859 | 891 / 2,669 |
| Posts of 600+ chars vs under 280 | 740 | +0.0539 | 424 / 185 | +0.0034 | 370 / 356 |
Adding a link changes an account's bookmarks per view by a median of exactly zero, and slightly more accounts go down than up. What a link does is cut likes per view, by a median of 1.89 per 1,000 views, with 2,669 of 3,560 decided accounts falling. So the link lift in the bookmark to like ratio is a collapsing denominator. The cross-sectional table above is arithmetically correct and behaviourally misleading, which is exactly the failure mode worth publishing.
The length result survives the same test. Long posts raise an account's own bookmarks per 1,000 views by a median of 0.0539, with 424 accounts up against 185 down, while leaving likes per view at a coin flip: 370 up, 356 down, median change 0.0034. A 3% replication on 132 accounts gave the same direction at +0.1220, 77 up against 32 down. Length is associated with saving in a way links are not, on a within-account comparison rather than a pooled one.
How many posts do you need before the number means anything?
More than most profile tools use. Cutting the scored accounts by how many original posts went into the score, on a later pull holding 94,357 of them, the median rate is fairly stable but the upper tail collapses as depth grows. The 90th percentile falls from 0.7056 on accounts scored from one to four posts, to 0.0724 on accounts scored from 100 or more. That is a 9.7x difference in what looks like the same statistic.
| Original posts sampled | Accounts | Median rate | 90th percentile rate | Median post has zero bookmarks |
|---|---|---|---|---|
| 1 to 4 | 25,626 | 0.0369 | 0.7056 | 29.2% |
| 5 to 9 | 14,172 | 0.0382 | 0.5051 | 27.5% |
| 10 to 29 | 27,335 | 0.0343 | 0.3723 | 28.7% |
| 30 to 99 | 24,112 | 0.0235 | 0.2672 | 34.2% |
| 100 or more | 3,112 | 0.0131 | 0.0724 | 29.9% |
A spectacular bookmark rate computed on three posts is mostly luck about which three posts. That is why the benchmark table at the top of this article is drawn from accounts with ten or more sampled originals, and why a seller screenshot showing one saved post proves close to nothing.
What a buyer should ask about a high bookmark rate
Bookmarks are worth checking precisely because they sit outside the engagement number. If an account's engagement rate looks ordinary but its bookmark rate clears the 90th percentile we measured, 0.3018% of views, the account is producing reference material people return to. That is a different asset from reaction bait, and it plausibly survives a change of owner better, because the value sits in the archive rather than in the personality. That last clause is inference, not measurement.
Two checks make the signal usable. Ask how many posts the rate was computed over, since the depth table shows why that matters. Ask whether it is measured against views or against followers, because those differ by orders of magnitude and ours is against views. Our follower audit tool and the X account due diligence checklist cover the rest of the pre-purchase work, and listings on our account marketplace carry the ownership history a bookmark rate cannot tell you. At the top of the size range, the creator and influencer accounts above 100,000 followers are where the absolute counts we measured get large.
What we did not measure and why
We did not cut bookmarks by hour of day or day of week. Our sampler visits on a cadence, and a past batch threw away an entire hour-of-day curve after consecutive sweeps moved one platform's median by 27.76% while another moved 0.91%. That is a crawler pattern, not an audience one, and bookmarks are too sparse a counter to survive it.
We did not compare threads to single posts and we did not use our internal peer deciles. Retweet rows are excluded everywhere, for the reason given above. Every number here describes accounts our directory has scored, which the coverage gap shows is a selected slice of X rather than a random draw from it.
Common questions about X bookmark rates
The questions below come up repeatedly from buyers and sellers reading account statistics. Each answer names the sample it comes from.
What is the average bookmark rate on X?
The median is more useful than the average because the distribution is heavy tailed. Across 54,559 accounts with ten or more sampled original posts, the median bookmark rate is 0.0273% of views, the 75th percentile is 0.0928% and the 90th is 0.3018%. The arithmetic mean across all 94,318 scored accounts is 0.1633%, which is roughly five times the median and describes almost nobody.
How many bookmarks does a normal tweet get?
Two. Across 100,607 original posts created in 2026 in our 3% sample, the median bookmark count is 2, the 75th percentile is 23 and the 90th is 154. A third of posts, 33.50%, get none. The maximum in that sample was 249,841, which is why the mean of 145.14 is not a useful summary of anything.
How do bookmarks compare to likes on X?
At the median post, likes outnumber bookmarks about 35 to 1, a ratio of 0.0282 measured on 93,341 originals with at least one like. Pooled across the whole sample the ratio is 0.0882, closer to 11 to 1, because posts with more reach are saved at a higher rate. Only 0.60% of liked originals ended up with more bookmarks than likes.
Does buying a bigger account get you a better bookmark rate?
Not really. Median bookmark rate peaks at 0.0363% in the 78,305 to 99,999 follower window and falls to 0.0214% above a million, across 54,559 scored accounts. Absolute bookmark counts do rise with size, from a median of 0 per post below 1,000 followers to 9 above a million, but the bookmark to like ratio stays between 0.030 and 0.038 across the whole range.
Are bookmarks a better signal than engagement rate?
They are a different signal, which is more valuable than a better one. On 54,559 accounts, the view engagement rate correlates with the plain like rate at a Spearman rho of 0.9808, while the bookmark rate correlates with it at 0.5023. Roughly half of what the bookmark rate ranks is invisible to an engagement rate. It is also nearly independent of follower count at rho 0.1209.
Do links in a post get more bookmarks?
No. Within 3,636 accounts that post both with and without links, adding a link changes bookmarks per 1,000 views by a median of exactly zero, with 1,762 accounts falling against 1,123 rising. It cuts likes per 1,000 views by a median of 1.89. The higher bookmark to like ratio on link posts you see in pooled data comes from lost likes, not gained saves.
What kind of post gets bookmarked most?
Long ones. Posts of 1,500 characters or more, 849 of them in our sample, carry 0.494 bookmarks per 1,000 views and a bookmark to like ratio of 0.0729, roughly 3x the 200 to 279 character band. Within 740 accounts that write both long and short, long posts lifted the account's own bookmarks per 1,000 views by a median of 0.0539 while leaving likes per view unchanged.
Can a seller fake a bookmark rate?
The manipulation we can measure is selection, not inflation. Our depth table shows the 90th percentile rate falling 9.7x, from 0.7056 to 0.0724, as the post count behind a score grows from under five to over a hundred, so a spectacular rate quoted over three posts costs nothing to arrange. Whether saves themselves can be bought is not something we tested, and we make no claim either way. Always ask for the denominator.
Contributing writer at PlayerSells, covering X (Twitter) account trading, market analysis, and security best practices.
Related Articles
Continue learning with these related guides.
Does Twitch Account Age Still Matter? We Measured 432,192
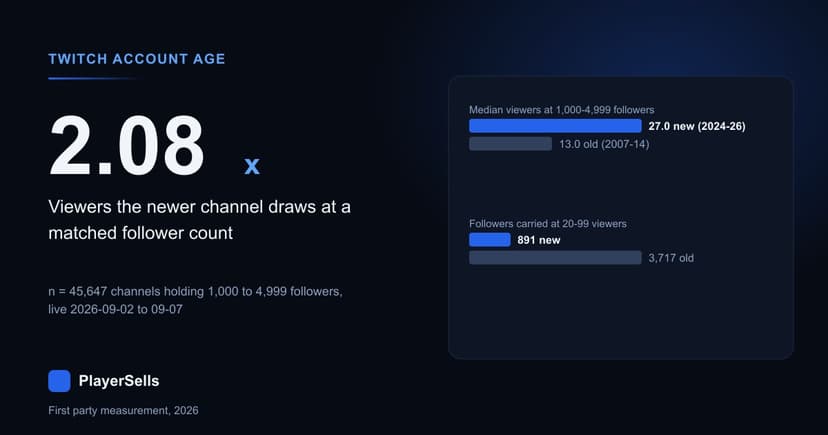
Across 432,192 Twitch channels read on 2026-09-08, account age is almost pure accumulation, and at a matched follower count the newer channel wins.
Where X Posts Come From: 617,398 Posts by Source Label
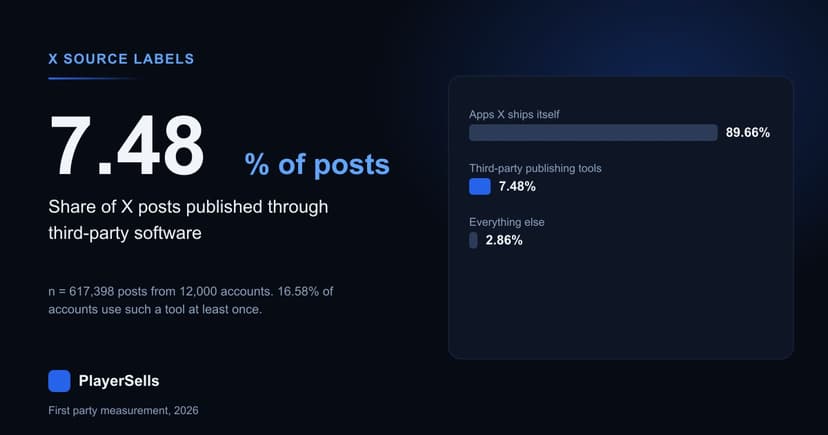
We read the source label on 617,398 X posts from 12,000 accounts: 89.66% came from an app X ships, and 7.48% from third-party publishing software.
What Is a Good Engagement Rate on X? 27,844 Measured
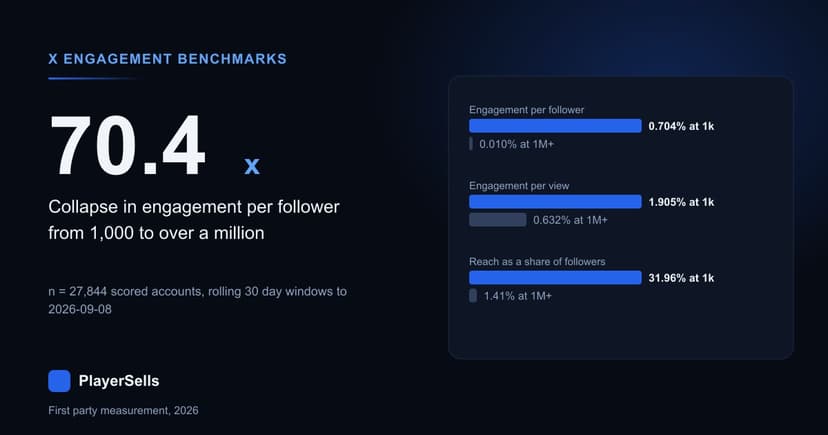
The median X account near 100,000 followers posts at 0.072% engagement per follower and 0.010% above a million, measured on 27,844 scored accounts.