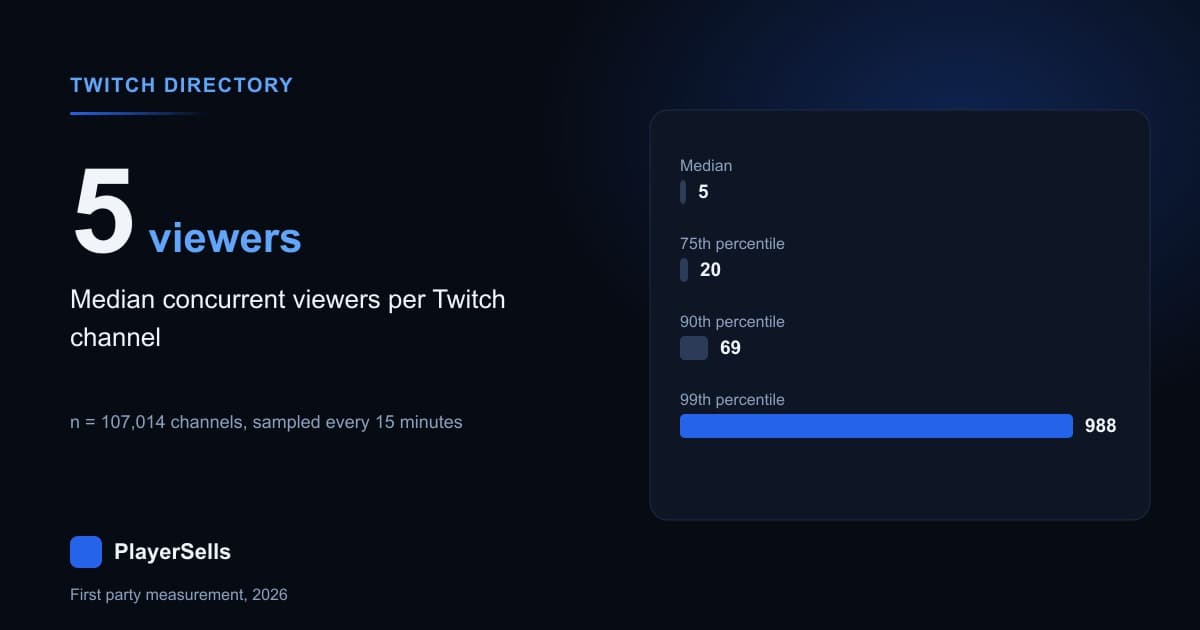
The median Twitch channel averaged 5 concurrent viewers. We measured that across 107,014 channels observed live with at least one viewer, sampled every 15 minutes between 2026-09-01 12:57 UTC and 2026-09-02 15:03 UTC. Half of those channels averaged 5 viewers or fewer. Only 8,268 of them, 7.73 percent, averaged 100 or more, and just 1,058 channels, 0.99 percent, averaged 1,000 or more.
That is the answer to "average viewers on Twitch" in 2026, and it is deliberately a median rather than a mean. The mean across the same 107,014 channels is 60.3 concurrent viewers, twelve times the median, and it describes almost nobody. One channel in our crawl averaged 85,044 concurrent viewers. Means are not useful on a distribution shaped like this one, and every published Twitch "average" that quotes one is describing the top of the list rather than the channel you are actually looking at.
The second thing worth saying immediately: the number we can defend is not "the median Twitch channel". It is the median channel that went live and drew at least one viewer during our observation window. Channels that never went live in those 26 hours are absent, and channels that streamed to nobody at all are only partly captured. Both exclusions push the real population median down, not up. Five is a ceiling on the typical channel, not a floor.
What does the full concurrent viewer distribution look like?
Our Twitch directory holds 126,424 channel records. Of those, 107,014 carried a positive average concurrent viewer figure derived from our own 15-minute sweeps, 3,688 were seen live but averaged below half a viewer and rounded to zero, and 16,153 sat in the directory without ever being observed live. The percentile ladder below is computed on the 107,014 with a positive reading.
These are per-channel averages of concurrent viewership across every 15-minute sweep in which the channel was live. The table reads as a ladder: find the number of viewers a channel actually gets, then read across to see what share of the measured field it is ahead of.
| Percentile | Average concurrent viewers | What it means |
|---|---|---|
| 10th | 1 | Bottom tenth of live channels |
| 25th | 2 | A quarter of channels sit at or below this |
| 50th (median) | 5 | The typical measured channel |
| 75th | 16 | Top quarter starts here |
| 90th | 69 | Top tenth |
| 95th | 174 | Top twentieth |
| 99th | 988 | Top 1,070 channels |
| 99.9th | 5,668 | Top 107 channels |
| Maximum | 85,044 | Largest single channel measured |
We re-derived this ladder a second way as a check, rebuilding each channel's average from the raw daily rows weighted by sample count rather than reading the stored column. That independent pass returned a median of 5.00, a 90th percentile of 69.0 and a 99th percentile of 986.8 across 107,161 channels. Two formulations landing on the same ladder is the reason we are willing to publish it.
How many Twitch channels get more than 10, 50 or 100 viewers?
The threshold view is more useful than percentiles if you are trying to place one specific channel rather than describe the field. Every count below is measured against the same base of 107,014 channels carrying a positive average concurrent viewer reading in our crawl, so the shares are directly comparable to each other and to the percentile ladder above.
| Average concurrent viewers | Channels at or above | Share of measured channels |
|---|---|---|
| 3 or more | 71,144 | 66.48% |
| 5 or more | 54,189 | 50.64% |
| 10 or more | 36,237 | 33.86% |
| 20 or more | 23,646 | 22.10% |
| 50 or more | 13,379 | 12.50% |
| 100 or more | 8,268 | 7.73% |
| 250 or more | 3,951 | 3.69% |
| 500 or more | 2,140 | 2.00% |
| 1,000 or more | 1,058 | 0.99% |
| 5,000 or more | 128 | 0.12% |
| 10,000 or more | 55 | 0.05% |
Two lines in that table deserve a pause. Reaching 10 average concurrent viewers puts a channel in the top 33.86 percent of everything we measured. Reaching 100 puts it in the top 7.73 percent. The step from 10 to 100, modest as it sounds, moves a channel past roughly a quarter of the measured field. That is where the number stops being a hobby metric and starts being an asset. Place a specific handle against the wider Twitch population with our Twitch follower rank checker, and browse the measured population itself in the Twitch channel directory.
Why is our number lower than published Twitch averages?
Most Twitch statistics in circulation come from top-list scrapes. Those tools chart channels large enough to appear on a leaderboard, then compute an average over the charted set. That is a coherent thing to do, but the resulting number answers a different question. It tells you the average of channels big enough to be tracked, not the average of channels.
We built the sample the other way around. Our engine enumerates the live directory every 15 minutes and records whoever is on it, including streams sitting at zero viewers. In our own crawl of 2026-09-02, an individual sweep recorded a mean of 9,010 live channels, with a low of 3,006 and a high of 12,421, and 2.4 percent of the channels in a typical sweep were broadcasting to zero viewers at that instant. A leaderboard scrape never sees that part of the distribution, and that part is exactly what drags the median down to 5.
Being honest about our own ceiling: we do not claim to have enumerated every stream live on Twitch at every instant. Zero-viewer streams appear in our sweeps but are clearly not exhausted, and that floor is where our pagination stops. The direction of the bias is one way. Every channel we are missing sits at or near zero viewers, so a complete enumeration would push the median below 5 rather than above it.
What does partner status actually buy in viewers?
Broadcaster type is one of the few fields Twitch exposes that is fully populated across our directory, present on all 126,424 records. The split is 66,440 affiliates (52.6 percent), 46,848 with no status (37.1 percent) and 13,136 partners (10.4 percent). Restricted to channels with a positive viewer reading, the separation between the three tiers is the widest gap we measured anywhere in the Twitch data.
| Broadcaster type | Channels measured | Median concurrent viewers | 90th percentile viewers | Median followers |
|---|---|---|---|---|
| Partner | 11,500 | 119 | 830 | 21,599 |
| Affiliate | 57,750 | 7 | 34 | 478 |
| No status | 37,764 | 2 | 5 | 24 |
A partner channel's median of 119 concurrent viewers is 17 times the affiliate median of 7 and 59.5 times the median of 2 for channels carrying no status. Of the 11,500 measured partners, 6,524 (56.7 percent) averaged 100 or more concurrent viewers and only 239 (2.1 percent) averaged fewer than 10. Partner status is the cleanest public size signal we found on Twitch, which matters to a buyer because it is verifiable from the public API rather than from a screenshot of a good night. Our piece on what verification is actually worth when you buy an account covers how much weight platform badges deserve in general.
This is cross-sectional data, so read the direction carefully. Partner status is associated with larger audiences because Twitch grants it to channels that already have them, and the causation in our measurement runs from audience to badge rather than the other way. Nothing here says the badge produces the viewers, and a buyer paying a premium purely for the label is paying for a symptom.
Why does the follower gap widen as a channel grows?
Followers are the number a seller quotes. Concurrent viewers are the number that earns. The gap between the two is not constant, and it moves in the direction most sellers would prefer a buyer did not notice. The table below bands the 107,014 measured channels by average concurrent viewers and reports the median follower count in each band, alongside the median number of followers each channel carries per concurrent viewer.
| Average concurrent viewers | Channels | Share | Median followers | Median followers per viewer | Median account age |
|---|---|---|---|---|---|
| 1 to 2 | 35,870 | 33.5% | 37 | 29.0 | 5.3 years |
| 3 to 9 | 34,907 | 32.6% | 195 | 40.0 | 6.4 years |
| 10 to 49 | 22,858 | 21.4% | 1,118 | 59.8 | 7.3 years |
| 50 to 99 | 5,111 | 4.8% | 5,367 | 77.8 | 7.9 years |
| 100 to 499 | 6,128 | 5.7% | 20,610 | 107.3 | 8.5 years |
| 500 to 999 | 1,082 | 1.0% | 84,466 | 125.3 | 9.2 years |
| 1,000 or more | 1,058 | 1.0% | 252,901 | 121.7 | 9.7 years |
A channel averaging 1 or 2 viewers carries a median of 29.0 followers per viewer. A channel averaging 500 to 999 carries 125.3. Followers accumulate faster than live attendance does, so a follower on a large channel is associated with materially less live reach than a follower on a small one. We checked this two ways: taking the ratio of the two medians in each band, instead of the median of the per-channel ratios, gives 37.0, 39.0, 62.1, 78.9, 113.9, 126.4 and 145.7, which climbs across the same bands. The ladder flattens above 500 average viewers, so we would not push a strictly monotonic claim into the top band.
Median account age climbs across the same bands, from 5.3 years at the bottom to 9.7 years at the top, measured from the creation date Twitch exposes on the 126,417 channels where it is populated. Age is associated with audience in this cut. It is not a lever, and buying an old dormant channel does not import the audience of an old active one.
How concentrated is Twitch viewership?
Summing every channel's average concurrent viewership across the 107,014 measured channels gives 6,452,554. That figure is not a count of people, it is the total of per-channel averages, and dividing it up is the fastest way to see how thin the field below the top actually is. We ran the same split on hours watched as a second formulation, and both appear side by side below.
| Group | Channels | Share of measured viewership | Share of measured hours watched |
|---|---|---|---|
| Top 0.1% | 107 | 22.3% | 30.8% |
| Top 1% | 1,070 | 51.6% | 64.1% |
| Top 10% | 10,701 | 86.5% | 93.2% |
| Bottom 90% | 96,313 | 13.5% | 6.8% |
The top 1,070 channels held 51.6 percent of all measured average concurrent viewership. Measured on hours watched instead, those same 1,070 channels held 64.1 percent, because large channels also stream longer, so their airtime advantage compounds their audience advantage. The two metrics differ in magnitude and agree in direction, which is what a real concentration effect looks like. Heavy-tailed audience distributions are the norm across every directory we run, and the follower-side version for X sits in our X follower count benchmarks measured across 17 million accounts. On Twitch, this concentration is why streaming acquisitions are priced on viewers rather than followers.
How long does a typical channel actually stay live?
Airtime is the other half of the picture, and our sweeps measure it directly: each 15-minute sweep in which a channel appears is 15 minutes of observed airtime. Across the 107,014 measured channels, the median channel was live for 2.00 hours inside our window, the 90th percentile was 5.25 hours, and the longest observed airtime was 25.50 hours. Of the 122,056 channels with any daily row at all, 99,443 appeared on only one of the two calendar dates and 22,613 appeared on both.
The median channel's peak concurrent viewership was 6 against a median average of 5, a peak-to-average ratio of 1.28. That number is worth remembering the next time a seller sends a screenshot. On a typical channel the best moment of a stream sits 28 percent above the sustained level, so a peak figure quoted without an average overstates by roughly a third at the median, and by considerably more on the channels where the peak is being quoted deliberately. To work out what an audience earns rather than what it displays, our Twitch money calculator starts from viewer counts instead of follower counts.
How we measured this
Our Twitch engine enumerates the platform's live directory on a fixed 15-minute cadence. We confirmed the cadence from the raw sample timestamps rather than trusting the configuration: consecutive sweeps on 2026-09-02 landed at 12:09, 12:24, 12:39 and 12:54 UTC. Every channel found live in a sweep gets one row carrying its instantaneous viewer count, and the per-channel averages in this article are rebuilt from those rows.
The observation window runs from 2026-09-01 12:57 UTC to 2026-09-02 15:03 UTC, roughly 26 hours. That is the entire lifetime of this engine, which went live on 2026-09-01. It is enough for a cross-sectional distribution and it is not enough for anything longitudinal, so this article contains no growth, churn or trend claim about Twitch, and any Twitch trend figure attributed to us before this engine has a real history should be treated as unsupported.
One correction to our own schema belongs in public, because our column names would otherwise mislead anyone reading them. The channel table stores fields named for a 30-day window. They are not 30-day figures. We verified that each channel's stored airtime equals the exact sum of its daily rows, a median difference of 0.000 hours across 122,056 channels, and the daily table covers two dates. Maximum stored airtime across the directory is 25.50 hours, impossible for a real 30-day window and exactly right for a 26-hour one.
What did we reject before publishing?
We ran the conditioning checks that have faked findings for us before. Median concurrent viewership rises sharply with the number of sweeps a channel appears in: 3 viewers for channels seen in 1 or 2 sweeps, 7 for those seen in 9 to 24, and 18 for those seen in 25 to 48. That pattern looks like a crawler artifact and is not one, because a sweep count is airtime rather than crawl intensity. We enumerate the whole live directory on every pass, so a channel is not sampled more often for being interesting. We publish it as a conditioned observation and not as a headline.
The day-count cut we did reject. Channels observed on both dates showed a median of 7 concurrent viewers against 4 for channels seen on a single date. That is a survivor filter rather than a property of channel size: a channel appears on both dates because it streamed on both dates, and streaming more is the thing being measured. Presenting it as a size finding would have been a straightforward mistake.
We also dropped the absolute hours-watched total. We measured 31.0 million hours watched inside the window, but with a mean of 9,010 channels captured per sweep we cannot demonstrate a complete enumeration, and an absolute total invites comparison against third-party monthly figures built on a different denominator. The concentration shares survive that objection, because the channels we are missing sit at or near zero viewers and contribute almost nothing to either total.
What this means if you are buying or selling a Twitch channel
Price on concurrent viewers, and insist on the average rather than the peak. The percentile ladder is the whole negotiation: a channel averaging 20 concurrent viewers genuinely sits in the top 22.10 percent of the 107,014 we measured, while a channel averaging 5 is exactly average and should be priced that way no matter how many followers it carries. Follower count is the weaker signal at every tier, and it weakens further as channels grow, from 29.0 followers per viewer in the bottom band to 125.3 in the 500 to 999 band.
Ask for broadcaster type in writing, because it is verifiable from the public API and it separates the field cleanly at 119, 7 and 2 median viewers. Ask for airtime alongside viewers, because the median measured channel streamed 2.00 hours in our window, and a viewer average built on two hours is a different asset from the same average built on twenty. Our Twitch channel value estimator takes both inputs. When the numbers check out, streaming inventory sits beside every other platform in the PlayerSells marketplace, the direct route is buying a Twitch channel, and sellers can list a channel for sale with viewer figures attached.
Common questions about average viewers on Twitch
These are the questions we field most often about the concurrent viewer distribution, each answered from the same 107,014-channel measurement taken between 2026-09-01 and 2026-09-02. Where an answer depends on a filter or a denominator, the filter is named in the answer rather than left to a footnote.
What is a good average viewer count on Twitch?
Ten average concurrent viewers puts a channel in the top 33.86 percent of the 107,014 channels we measured, 50 puts it in the top 12.50 percent, and 100 puts it in the top 7.73 percent. Anything below 5 is the bottom half. Those thresholds land lower than most streamers expect, because the published averages they compare themselves against are computed on leaderboard channels rather than on the whole field.
Is 5 concurrent viewers really the Twitch average?
Five is the median across 107,014 channels observed live with at least one viewer between 2026-09-01 and 2026-09-02. The mean over the same set is 60.3, inflated by a maximum of 85,044. We publish the median because the distribution is heavy-tailed and the mean describes no real channel. The true population median is probably below 5, since channels that never went live in our window are absent from the sample.
How many Twitch channels have over 1,000 average viewers?
We measured 1,058 channels averaging 1,000 or more concurrent viewers, which is 0.99 percent of the 107,014 with a positive reading. Above that, 128 channels averaged 5,000 or more and 55 averaged 10,000 or more. The single largest channel in our crawl averaged 85,044 concurrent viewers across the observation window, against a peak of 125,204 in one sample.
Do Twitch followers translate into viewers?
Weakly, and less well as channels grow. The median channel averaging 1 or 2 concurrent viewers carries 29.0 followers per viewer, while the median channel averaging 500 to 999 carries 125.3. Median follower counts by viewer band run 37, 195, 1,118, 5,367, 20,610, 84,466 and 252,901 across our seven bands, so follower count separates tiers but overstates live reach at the top.
What percentage of Twitch channels are partners?
Partners are 13,136 of the 126,424 channels in our directory, or 10.4 percent, against 66,440 affiliates (52.6 percent) and 46,848 with no status (37.1 percent). Among the 11,500 partners with a positive viewer reading, 6,524 averaged 100 or more concurrent viewers and only 239 averaged fewer than 10.
How much of Twitch's audience goes to the biggest channels?
The top 1,070 channels, 1 percent of the 107,014 we measured, held 51.6 percent of total measured average concurrent viewership and 64.1 percent of measured hours watched. The top 107 channels alone held 22.3 percent of viewership. The bottom 90 percent, 96,313 channels, shared 13.5 percent of viewership and 6.8 percent of hours watched between them.
Can you measure Twitch channel growth from this data?
No, and we will not publish one. Our Twitch engine went live on 2026-09-01 and the daily statistics table covers 2026-09-01 and 2026-09-02 only, a window of roughly 26 hours. Cross-sectional distributions are sound on that window. Growth rates, churn and trend lines are not, and we will hold those claims until the engine has months of history behind it.
Related Articles
Continue learning with these related guides.
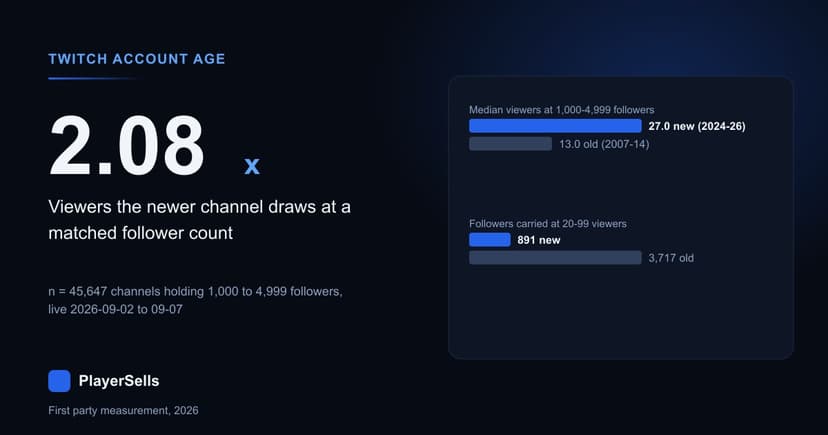
Does Twitch Account Age Still Matter? We Measured 432,192
Across 432,192 Twitch channels read on 2026-09-08, account age is almost pure accumulation, and at a matched follower count the newer channel wins.
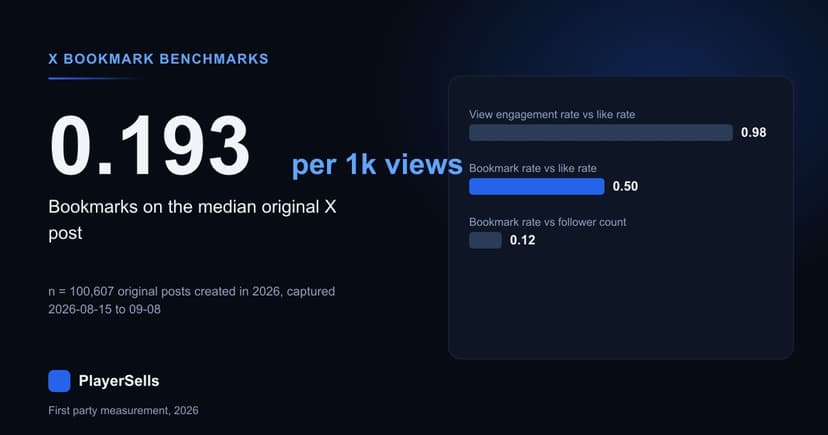
X Bookmark Rate Benchmarks From 94,318 Scored Accounts
Half the X accounts we scored on ten or more posts bookmark under 0.0273% of their views, and a third of original posts get no bookmarks at all.