
Bluesky's Election Night Spike Faded in Four Days
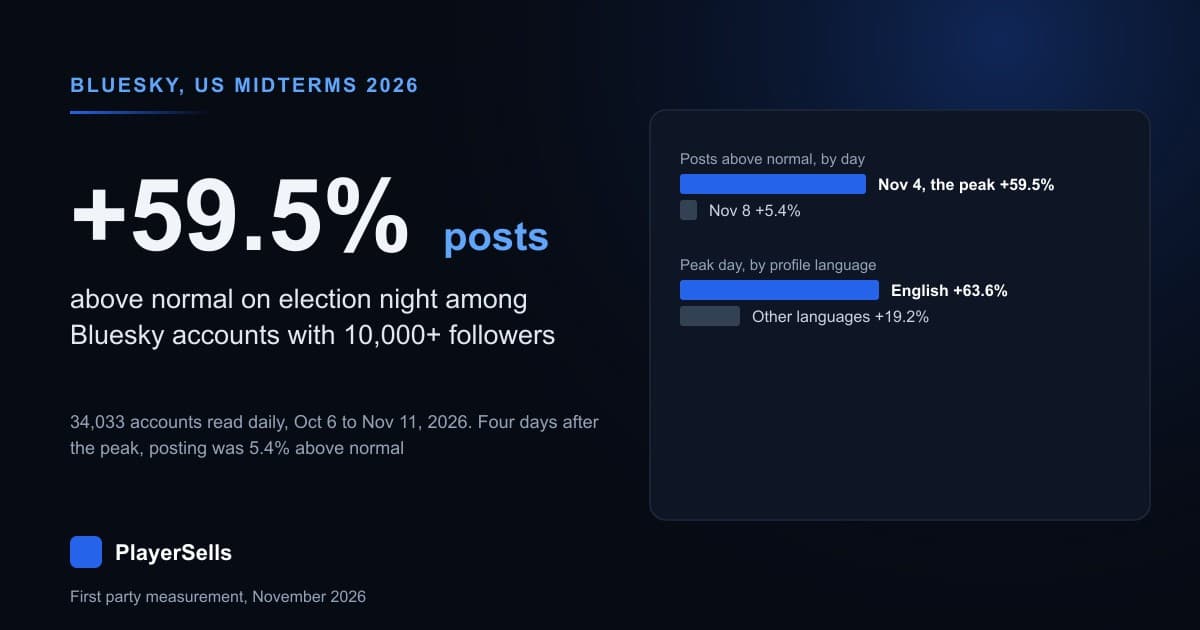
We tracked 34,033 Bluesky accounts with 10,000+ followers through the 2026 midterms. Posting peaked 59.5% above normal and was 5.4% above four days later.
Bluesky's election night surge was large and short. Across 34,033 Bluesky accounts with at least 10,000 followers, posting on November 4, 2026 (UTC), the night the US midterm results came in, ran 59.5% above the same weekday in the four weeks before. Four days later, on November 8, it was 5.4% above. Over the whole election week the panel wrote 23.5% more than in a normal week, 267,142 extra posts, and 74.2% of that excess landed in the first three days. A week after the vote, on November 10 and 11, posting was still 7.3% above the level before the election.
These figures come from PlayerSells' own Bluesky directory, which reads the public follower and post counters of every account above 10,000 followers about once a day. Bluesky's own numbers set the scene: TechCrunch reported on November 5 that the network had its highest daily number of posts, replies and likes of 2026, that daily posts and likes rose 30% and 70% against the previous 30-day averages, and that open data showed 44 million likes, 4.8 million posts and 2 million new follows on November 4. That report describes the whole network on one day. This one follows a fixed set of large accounts for 37 days, so it can say how long the surge lasted, who produced it, and whether quiet accounts came back.
How big was Bluesky's election night spike among large accounts?
About 60% on the peak day. The 34,033 accounts wrote 266,963 posts and replies on November 4 against a same weekday average of 167,329, a rise of 59.5%. Election day itself (November 3 UTC) was 30.2% above normal and the day after the peak was 28.6% above. TechCrunch quotes Bluesky's COO Rose Wang as saying usage began to peak between 8 p.m. and 10 p.m. PT, which is 04:00 to 06:00 UTC on November 4, so the UTC day of November 4 holds the night itself.
| Day (UTC) | Posts by the panel | Same weekday, four week average | Difference |
|---|---|---|---|
| Sun, Nov 1 | 155,060 | 148,745 | +4.2% |
| Mon, Nov 2 | 172,449 | 163,036 | +5.8% |
| Tue, Nov 3 | 217,217 | 166,843 | +30.2% |
| Wed, Nov 4 | 266,963 | 167,329 | +59.5% |
| Thu, Nov 5 | 216,706 | 168,572 | +28.6% |
| Fri, Nov 6 | 202,524 | 168,173 | +20.4% |
| Sat, Nov 7 | 172,790 | 152,400 | +13.4% |
| Sun, Nov 8 | 156,763 | 148,745 | +5.4% |
| Mon, Nov 9 | 169,278 | 163,036 | +3.8% |
| Tue, Nov 10 | 179,133 | 166,843 | +7.4% |
| Wed, Nov 11 | 179,350 | 167,329 | +7.2% |
34,033 Bluesky accounts with 10,000+ followers, November 1 to 11, 2026. Posts and replies; Bluesky's post counter does not include reposts. Baseline: October 6 to November 2, 2026.
Large accounts reacted more strongly than the network as a whole. The figure TechCrunch reported for the whole network was a 30% rise in daily posts against the previous 30-day average. Measured the same way, against the plain average of the 28 days before rather than the same weekday, our panel was 64.6% up on the peak day, roughly twice the network figure. The day boundaries differ (ours is the UTC day), so the ratio is approximate.
The true one day peak is higher than the table shows. Each account is read about once a day, so part of a one day jump is assigned to the days on either side. Among the 4,499 accounts that happened to be read within two hours of midnight UTC on both sides of November 4, where the day is measured almost exactly, posting was 77.1% above baseline.
How long did the election spike last?
Four days from the peak to within normal range. The excess over baseline went from 59.5% on November 4 to 28.6%, 20.4%, 13.4% and then 5.4% on Sunday, November 8, and 3.8% on Monday. For scale, in the first 26 days of the baseline no day was more than 5.3% away from the average of the other same weekdays, and the typical gap was 1.4%. The two days before the vote already ran 4.2% and 5.8% above the baseline they are part of, so the comparison is slightly conservative.
The surge did not vanish completely. On November 10 and 11, the Tuesday and Wednesday a week later, the panel was 7.4% and 7.2% above baseline, which is more than normal day to day variation. Accounts labelled politics were still 13.7% above their own baseline on those two days; news accounts were 3.5% above. Two days are too few to call it a new plateau.
Who drove the spike: political accounts or everyone?
Everyone who posts in English. Accounts whose profile marks them as political rose the most, 76.8% on the peak day, but accounts labelled news, accounts with other topic labels and accounts with no label all rose between 55.9% and 58.6%. Political accounts are 10.3% of the panel and produced 17.1% of the week's extra posts, which leaves 82.9% to accounts that are not labelled as political.
| Account group | Accounts | Posts per account per day, baseline | Peak day | Election week | November 10 and 11 | Share of extra posts |
|---|---|---|---|---|---|---|
| Politics | 3,497 | 5.99 | +76.8% | +31.1% | +13.7% | 17.1% |
| News | 2,255 | 6.93 | +58.3% | +21.3% | +3.5% | 8.7% |
| Other labelled topics | 8,368 | 5.24 | +58.6% | +23.3% | +6.8% | 26.7% |
| No topic label | 19,913 | 4.11 | +55.9% | +22.2% | +6.6% | 47.5% |
Topic labels come from keywords in the profile bio and cover 41.5% of the panel. Peak day is November 4; election week is November 3 to 9, 2026; all figures are against each group's own baseline.
Within the labelled accounts, almost every topic moved. Gaming accounts were the calmest, 28.5% above normal on the peak day and 3.9% over the week; sports accounts rose 54.2% on the night.
| Topic label | Accounts | Peak day | Election week |
|---|---|---|---|
| Politics | 3,497 | +76.8% | +31.1% |
| Design | 384 | +69.8% | +31.4% |
| Memes | 541 | +68.4% | +26.9% |
| Business | 325 | +68.2% | +30.3% |
| Education | 658 | +66.8% | +26.0% |
| Science | 846 | +65.8% | +23.3% |
| Tech | 327 | +63.5% | +27.7% |
| Movies | 549 | +61.7% | +27.0% |
| Crypto | 1,625 | +59.4% | +25.1% |
| News | 2,255 | +58.3% | +21.3% |
| Music | 945 | +55.1% | +20.7% |
| Sports | 688 | +54.2% | +15.7% |
| Travel | 314 | +49.5% | +26.3% |
| Gaming | 310 | +28.5% | +3.9% |
Topic labels with at least 300 accounts in the panel, sorted by the peak day rise. November 4 and November 3 to 9, 2026, against each group's own baseline.
Did the spike reach accounts that do not post in English?
Barely. English-language accounts rose 63.6% on the peak day and 25.4% over the week. Accounts in every other detected language rose 19.2% on the day and 3.5% over the week. English accounts are 85.1% of the panel and wrote 97.6% of the extra posts. The non-English accounts work as a check on the method: the same instrument, on the same days, shows almost no change where a US election should matter less.
| Profile language | Accounts | Peak day | Election week |
|---|---|---|---|
| English | 28,966 | +63.6% | +25.4% |
| All other detected languages | 3,799 | +19.2% | +3.5% |
| German | 420 | +31.0% | +9.5% |
| Japanese | 361 | +28.3% | +8.3% |
| Spanish | 307 | +18.3% | +2.2% |
| Turkish | 333 | +9.6% | +8.3% |
| French | 341 | +8.6% | -0.2% |
| Portuguese | 1,020 | -9.5% | -16.2% |
Language detected from the profile text; single languages listed where the panel has at least 300 accounts. November 4 and November 3 to 9, 2026, against each group's own baseline. Portuguese-language accounts were already posting less each week, 19.9% below baseline by November 10 and 11.
Did bigger accounts react more?
Only the very largest. The three bands between 10,000 and 99,999 followers rose by similar amounts on the peak day, between 53.8% and 58.5%. The 970 accounts with 100,000 or more followers more than doubled their output, 112.7% above baseline, and stayed 32.2% above over the week. Verified accounts (3,481 in the panel) rose 62.8% on the day against 59.0% for the rest.
| Followers on October 6 | Accounts | Posts per account per day, baseline | Peak day | Election week |
|---|---|---|---|---|
| 10,000 to 24,999 | 24,937 | 4.11 | +58.5% | +22.0% |
| 25,000 to 49,999 | 6,150 | 6.24 | +53.8% | +24.8% |
| 50,000 to 99,999 | 1,976 | 7.31 | +55.8% | +27.2% |
| 100,000 and more | 970 | 7.05 | +112.7% | +32.2% |
November 4 and November 3 to 9, 2026, against each band's own baseline.
Did "old friends" come back to Bluesky?
A few, and they wrote very little. TechCrunch quotes Bluesky CEO Toni Schneider as posting "We're seeing a wave of new people joining and old friends coming back." Among large accounts the second half of that sentence is visible but small. Of 10,123 panel accounts that had not posted for at least 21 days, 729 (7.2%) posted during election week. In the ordinary week before, 577 of 10,299 such accounts (5.6%) did the same, so the election brought back about 152 more accounts than a normal week would. The returning accounts wrote 3,891 posts between them, 0.28% of the week's total, with a median of 2 posts each, and 28.0% of them posted again on November 10 or 11.
The surge was made by accounts that were already active. 14,912 accounts (43.8% of the panel) normally post at least once a day midweek. In the 48 hours of November 4 and 5, 60.6% of them posted more than their own Wednesday and Thursday average and 24.3% at least doubled it. Running the same test on October 28 and 29 against the three earlier weeks gives 43.7% and 9.7%. The increase was also concentrated: the 340 accounts with the largest increases, 1% of the panel, added 104,006 posts, equal to 38.9% of the panel's net extra posts for the week.
The background matters here. 28.3% of these large accounts (9,625) did not post once in the 28 days before election week. Accounts created in November 2024, right after the previous US election, are 39.5% of the panel; 31.3% of them were silent for those 28 days, against 18.8% of accounts created before 2024. The ones that do post reacted like everyone else.
| Account created | Accounts | Silent in the 28 days before | Peak day | Election week |
|---|---|---|---|---|
| Joined before 2024 | 13,386 | 18.8% | +62.6% | +23.0% |
| Joined january to october 2024 | 4,213 | 41.3% | +44.1% | +19.6% |
| Joined november 2024 | 13,459 | 31.3% | +62.5% | +26.1% |
| Joined december 2024 or later | 2,975 | 39.1% | +48.2% | +19.3% |
Silent means the post counter did not change at any reading from October 6 to November 2, 2026. Peak day and election week are against each group's own baseline.
Did large accounts gain followers during election week?
Yes, but follower growth was already rising before the vote. The panel's combined follower count grew by 2,539,104 in election week, 16.3% more than the week before. The three weeks before that had each grown between 7.0% and 9.6% over the previous one. On the peak day the panel added 409,071 followers net, 33.0% more than on the previous Wednesday. For the typical account little changed: the median account grew 0.082% in election week against 0.076% the week before. News accounts gained the most, 28.2% more net new followers than the week before, against 12.7% for political accounts.
| Week | Net new followers, whole panel | Change on the previous week |
|---|---|---|
| October 6 to 12 | 1,699,694 | n/a |
| October 13 to 19 | 1,862,669 | +9.6% |
| October 20 to 26 | 1,992,495 | +7.0% |
| October 27 to November 2 | 2,182,309 | +9.5% |
| November 3 to 9 (election week) | 2,539,104 | +16.3% |
Sum of follower counts across the 34,033 accounts, Tuesday to Monday weeks, 2026. Net of unfollows.
Did the largest accounts on X react the same way?
Much less, but this is not a like for like comparison. Our X sample is a different kind of account: 3,552 very large accounts read about once an hour, with a median of 3,813,048 followers, against a median of 16,694 in the Bluesky panel. The 2,198 English-language accounts in it posted 16.2% more than their baseline on November 4 and 2.7% more over the week; single days in that sample sit up to 12.8% away from their baseline in normal weeks, so only the peak day stands out. News accounts were the exception at 47.3% on the peak day. X's counter also includes reposts, which Bluesky's does not.
| X accounts | Accounts | Peak day | Election week |
|---|---|---|---|
| All English-language accounts | 2,198 | +16.2% | +2.7% |
| English: news organisations and news accounts | 167 | +47.3% | +6.1% |
| English: everything else | 1,932 | +3.6% | +1.5% |
| Non-English accounts | 1,351 | +5.2% | -1.2% |
3,552 X accounts with a reading late in every UTC day from October 5 to November 11, 2026, same baseline and the same exclusions as the Bluesky panel. Median 3,813,048 followers.
How we measured
PlayerSells runs a Bluesky directory that reads the public profile counters (followers and posts) of every account above 10,000 followers. In this window the median time between two readings of the same account was 24.4 hours and 99.7% of the gaps were under 30 hours. For each account we estimated the post counter at every midnight UTC from October 6 to November 12, 2026 by linear interpolation between the readings on either side, and took the difference between consecutive midnights as that day's posts.
The panel is every account that had 10,000 or more followers on October 6 and a reading on both sides of every one of those midnights with no gap above 50 hours: 34,290 of the 46,730 accounts read in the window. We then removed 257 accounts: 142 that averaged more than 100 posts a day in the baseline (automated feeds would otherwise dominate the totals) and 116 whose counter fell by 100 or more between two readings (bulk deletions or counter resets), one of which is in both groups. That leaves 34,033 accounts with 961,963,059 followers between them.
The baseline is the four Tuesday to Monday weeks from October 6 to November 2, 2026. Every day is compared with the average of the same weekday in those four weeks; election week is November 3 to 9. The results hold under other choices. With no accounts removed, the peak day is 55.1% above baseline and the week 20.2%. Keeping only the 31,491 accounts whose readings were never more than 30 hours apart gives 60.2% and 23.7%. Capping every account at 200 posts a day gives 58.8% and 23.3%. Against the last week before the election only, the peak day is 57.1% above October 28 and election week 21.4% above the week before.
Topic labels are assigned from keywords in the profile bio and language is detected from the profile text. The aggregated tables are published as open data under CC BY 4.0 in the PlayerSells open-data repository; no account names are included.
Limitations
- Large accounts only. The panel is the 34,033 accounts above 10,000 followers that we read every day. It says nothing about smaller accounts or about people who joined during the election, so it cannot test the "new people joining" half of Bluesky's statement.
- One reading a day. Day boundaries are blurred by interpolation, which lowers the peak day and raises its neighbours. Totals over several days are not affected.
- The post counter is net. It counts posts and replies, not reposts or likes, and a deleted post lowers it. Posting is therefore slightly undercounted everywhere.
- The look a week later covers two days, November 10 and 11. With no accounts removed, those two days come out 8.6% below baseline instead of above, because the post counter of one excluded account fell by 57,983 in that time.
- Topic labels and languages are derived from profile text. They are approximate, and 58.5% of accounts have no topic label.
- Follower figures are net changes in a public counter; they do not separate new follows from unfollows.
- The X figures describe much larger accounts and a counter that includes reposts. They are context, not a platform comparison.
Frequently asked questions
How much did posting on Bluesky rise on election night 2026?
Among 34,033 accounts with 10,000 or more followers, posts and replies on November 4, 2026 (UTC) were 59.5% above the same weekday in the four weeks before. TechCrunch reported that daily posts across the whole network rose 30% against the previous 30-day average.
How long did Bluesky's election spike last?
About four days. The excess over normal fell from 59.5% on November 4 to 5.4% on November 8, and 74.2% of the week's extra posts came in the first three days. A week later posting was still 7.3% above the level before the election.
Was the Bluesky election spike only political accounts?
No. Accounts labelled politics rose 76.8% on the peak day, but accounts with other labels or none rose between 55.9% and 58.6%, and 82.9% of the extra posts came from accounts not labelled as political. The clear dividing line was language: non-English accounts rose 3.5% over the week.
Did inactive Bluesky accounts come back for the election?
Some did. 729 large accounts that had been silent for 21 days or more posted during election week, against 577 in the ordinary week before. Together they wrote 0.28% of the week's posts.
How many large Bluesky accounts are inactive?
In our panel, 28.3% of accounts with 10,000 or more followers did not post or reply once between October 6 and November 2, 2026. Among accounts created in November 2024 the share is 31.3%.
Is this the same number Bluesky reported?
No. The figures Bluesky and TechCrunch published cover every account on the network for one day. Ours cover a fixed panel of large accounts over 37 days, which is why they can show the decline after the peak and the split by topic, language and size.
Related on PlayerSells: the Bluesky account directory these readings come from, the Bluesky best posting time tool, the Bluesky follower rank checker, Bluesky trends, our earlier measurement of how X treats posts with links, and the open data catalogue.
Free tools for this topic

Published by the PlayerSells editorial team. Data comes from PlayerSells marketplace records and our own crawlers. About PlayerSells · Editorial policy
Related Articles
Continue learning with these related guides.
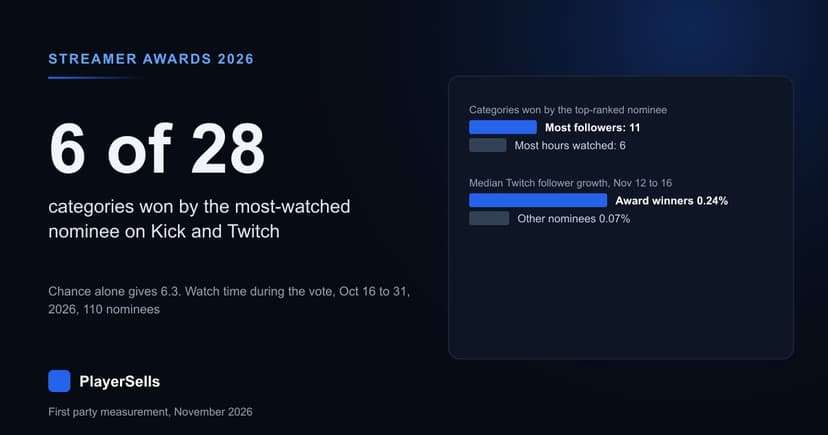
Streamer Awards 2026: Most-Watched Nominee Won 6 of 28
We checked 28 single-streamer categories against Kick and Twitch watch time. The most-watched nominee won 6, about chance. Winners then gained followers faster.
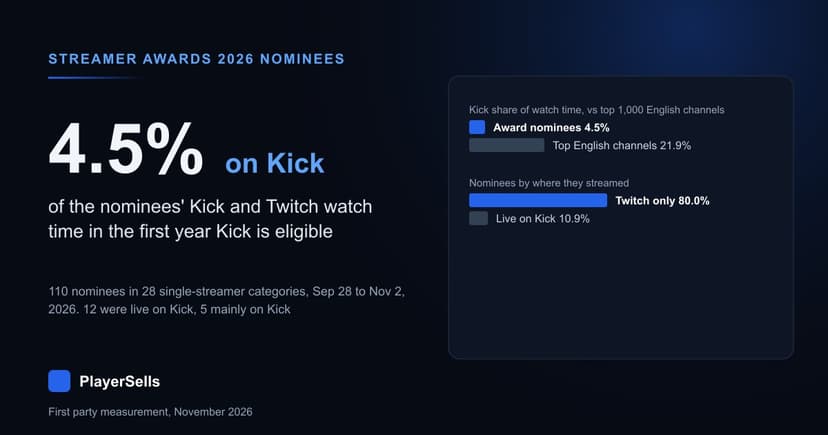
Streamer Awards 2026 Nominees: 4.5% of Watch Time on Kick
The 2026 Streamer Awards are the first open to Kick streamers. Of 110 nominees, 12 stream on Kick, which has 4.5% of their watch time.
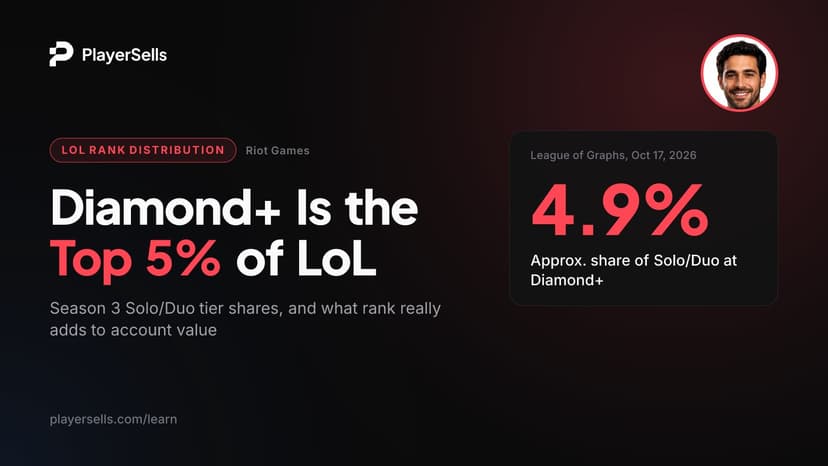
League of Legends Rank Distribution 2026 and Account Value
Gold is the most common LoL rank at 23% and Diamond+ is about the top 5%. See every tier's share this season and what really drives LoL account value.