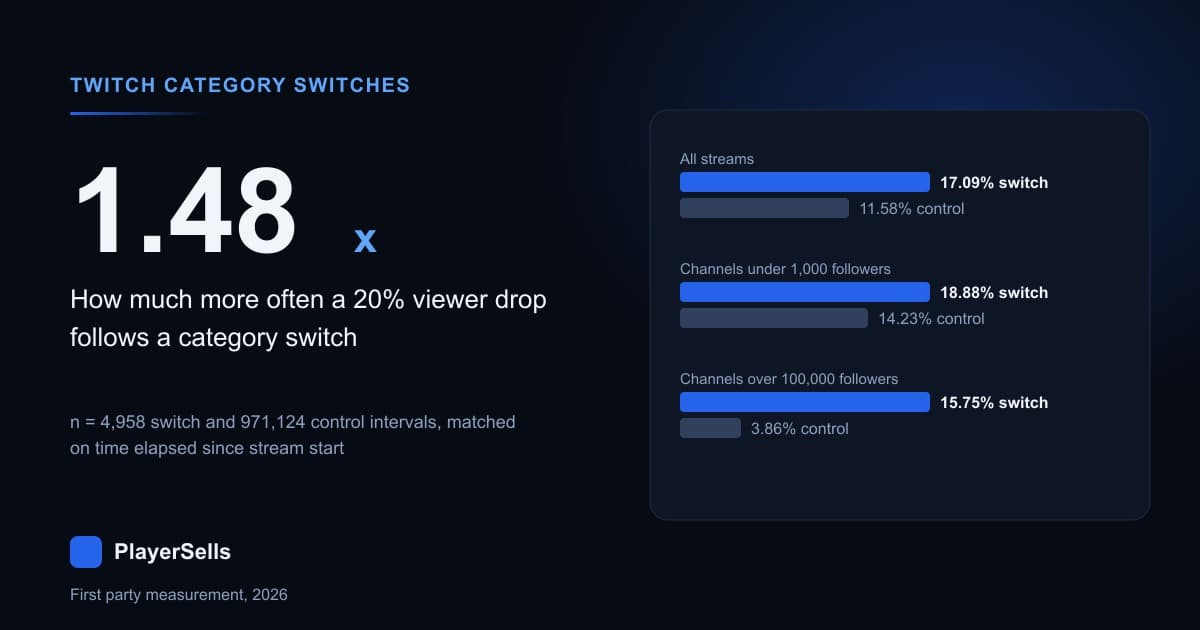
Across 122,761 Twitch streams that began on 2026-09-05 UTC, 5,252 of them (4.28 percent) changed category at least once while live. We measured what that costs by comparing each stream to itself: the viewer count in the sample immediately before the category changed against the sample immediately after, matched on how far into the broadcast the change landed. The median switching stream loses nothing, a viewer ratio of exactly 1.0000. The damage sits in the tail. A switch is followed by a viewer drop of more than 20 percent in 17.09 percent of cases, against 11.58 percent for a matched interval on a stream that kept the same category, across 4,958 switch transitions and 971,124 control transitions.
That 1.48x downside is not a decline that was already running. In the sampling interval immediately before the switch, those same streams dropped more than 20 percent only 10.59 percent of the time, marginally below the 11.10 percent control rate. The excess appears in the interval where the category changes and nowhere earlier. Every figure here comes from our own Twitch live sampler, which recorded 1,151,860 observations of 135,840 distinct streams on 2026-09-05 alone, and from the matching Kick sampler running beside it.
How often does a Twitch stream change category?
Less often than the argument about it suggests. Counting each UTC day on its own, between 3.64 percent and 3.88 percent of Twitch streams showed more than one category name during the six full days we have. The rate is remarkably flat: six consecutive days, a spread of 0.24 percentage points, no weekend effect worth naming. Pooled across those six days, 30,082 of 802,606 observed streams switched, or 3.75 percent.
Short observations hide switches, so the honest cut restricts to streams we sampled at least four times. That raises the rate to between 5.24 percent and 5.59 percent. Roughly one stream in eighteen that runs long enough to be watched properly changes category before it ends.
| UTC day | Streams observed | Streams with more than one category | Switch rate | Streams with 4 or more samples | Switch rate, 4 or more samples |
|---|---|---|---|---|---|
| 2026-09-02 | 131,585 | 4,945 | 3.758% | 87,226 | 5.376% |
| 2026-09-03 | 132,635 | 4,854 | 3.660% | 86,340 | 5.286% |
| 2026-09-04 | 131,382 | 4,779 | 3.637% | 86,255 | 5.238% |
| 2026-09-05 | 135,840 | 5,269 | 3.879% | 89,124 | 5.588% |
| 2026-09-06 | 135,807 | 5,150 | 3.792% | 88,256 | 5.534% |
| 2026-09-07 | 135,357 | 5,085 | 3.757% | 89,014 | 5.424% |
The midnight cut understates switching
Our live samples are stored one table per UTC day, so a broadcast that runs across 00:00 lands in two of them. Read a single day's table on its own and that stream looks like two shorter streams, each with fewer chances to show a category change. The unstitched rate for 2026-09-05 is 3.879 percent, or 5,269 of 135,840.
Stitching fixes it. We took every stream whose platform-reported start time fell inside 2026-09-05 UTC, followed it across both the 09-05 and 09-06 partitions on its stream identifier, and dropped anything still being sampled after 09-06 22:00 so nothing was cut off at the far end. That cohort holds 122,761 streams and its switch rate is 4.278 percent, or 5,252 streams. On the four-or-more-samples cut it goes from 5.588 percent to 6.031 percent. The midnight cut understates switching by about a tenth of its own value, and every number after this section uses the stitched cohort.
Does switching games cost you viewers?
For the typical stream, no. In all six time-in-stream buckets we measured, the median viewer ratio across a category change is 1.0000, identical to the median across an ordinary sampling interval on a stream that changed nothing. Half of all category switches move the viewer count by less than the sampler's own rounding.
The distribution around that median is the story. Matching on minutes elapsed since the platform-reported start, switch intervals carry a fatter downside in every bucket, and a modestly fatter upside as well. Standardising the switch rates onto the control group's elapsed-time profile gives 17.09 percent versus 11.58 percent for a drop past 20 percent, and 18.14 percent versus 15.04 percent for a gain past 25 percent. Switching does not shift the centre. It widens the outcome, and it widens it more downward than upward.
| Minutes into the stream | Control intervals (n) | Control: drop over 20% | Switch intervals (n) | Switch: drop over 20% | Switch: gain over 25% |
|---|---|---|---|---|---|
| 0 to 30 | 100,662 | 12.86% | 305 | 19.34% | 37.38% |
| 30 to 60 | 122,970 | 13.41% | 442 | 17.87% | 24.21% |
| 60 to 120 | 209,186 | 13.01% | 975 | 18.46% | 17.13% |
| 120 to 240 | 261,238 | 11.61% | 1,571 | 17.19% | 14.96% |
| 240 to 480 | 178,419 | 9.60% | 1,111 | 16.20% | 12.51% |
| 480 or more | 98,649 | 8.46% | 554 | 12.27% | 11.73% |
We ran the comparison three ways before publishing it. The adjacent-sample version on the 2026-09-05 cohort gives 17.09 percent against 11.58 percent. Repeated on an independent cohort of streams that started on 2026-09-02, it gives 16.88 percent against 11.41 percent from 4,612 switch transitions. A third formulation swaps single samples for three-sample block means either side of the change and returns 18.85 percent against 11.62 percent on 3,556 switches. Three methods, two days, the same answer.
Was the audience already leaving before the switch?
One objection would sink the whole finding, and it is testable. A streamer watching viewers drain away has an obvious reason to change category, in which case we would be measuring the cause of switching rather than its effect. So we looked at the interval immediately preceding each switch, requiring it to be free of any category change of its own.
Streams about to switch look completely ordinary right up to the moment they move. On 4,323 switch transitions with a clean prior interval, the pre-switch interval showed a drop past 20 percent 10.59 percent of the time, against 11.10 percent for 859,832 control intervals. Then the interval containing the switch jumps to 16.80 percent against a control rate of 11.46 percent. The median ratio is 1.0000 in all four cells. Whatever prompts a category change, a visible audience collapse in the previous fifteen minutes is not it. That holds inside the band where the median moves. Above 100,000 followers the interval before a switch dropped past 20 percent in 2.35 percent of cases against a 3.62 percent control rate, across 340 transitions with a clean prior interval, and its median ran 1.0026 against 1.0109. The decline arrives with the switch, not ahead of it.
Does channel size change what a switch costs?
Enormously, and this is the result a buyer should care about most. We joined each stream to its channel record in our Twitch directory, which holds the channels our sampler caught broadcasting during the window, and repeated the standardised comparison inside each follower band. Small channels barely notice a switch. Large channels pay for it heavily, because their baseline is steady enough that any disruption stands out.
A channel under 1,000 followers sees a drop past 20 percent in 18.88 percent of switch intervals against 14.23 percent of its own control intervals, a ratio of 1.33x. A channel above 100,000 followers sees 15.75 percent against 3.86 percent, a ratio of 4.08x. The top band is also the only one where the median itself moves, and the reason is arithmetic. A stream sitting on six viewers can only return a ratio of 1.00, 0.83 or 1.17, so the pooled median of 1.0000 above is largely small channels whose counts cannot express a small change. Where the counts are big enough to move, they do. The standardised median ratio in the top band is 0.9699 across a switch against 1.0205 across a control interval, and the control is rising rather than flat.
| Channel followers | Control intervals (n) | Control: drop over 20% | Switch intervals (n) | Switch: drop over 20% | Ratio | Median ratio across a switch |
|---|---|---|---|---|---|---|
| Under 1,000 | 604,817 | 14.23% | 2,519 | 18.88% | 1.33x | 1.0000 |
| 1,000 to 10,000 | 233,344 | 8.89% | 1,419 | 15.52% | 1.75x | 0.9996 |
| 10,000 to 100,000 | 95,455 | 4.40% | 631 | 12.67% | 2.88x | 0.9860 |
| 100,000 or more | 37,507 | 3.86% | 389 | 15.75% | 4.08x | 0.9699 |
The upside column sharpens the asymmetry. In the two largest bands the gain rate barely moves: 8.59 percent against a control 8.91 percent for 10,000 to 100,000 followers, and 8.90 percent against 7.48 percent above 100,000. A big channel that switches buys a much larger chance of a bad quarter-hour and almost no extra chance of a good one. Under 1,000 followers the bet is genuinely two-sided, 22.75 percent against a control 17.00 percent.
Bigger channels switch far more often
Switching is a large-channel habit, which is the opposite of what the cost table would recommend. Inside the 122,761-stream cohort, the switch rate climbs monotonically with follower count, from 1.61 percent below 100 followers to 13.92 percent above 100,000. That is an 8.7x spread. Restricting to streams with four or more samples, so that observation length is not doing the work, the spread narrows but survives: 2.60 percent to 15.44 percent, still 5.9x.
| Channel followers | Streams | Switched at least once | Switch rate | Streams with 4 or more samples | Switch rate, 4 or more samples |
|---|---|---|---|---|---|
| Under 100 | 50,101 | 806 | 1.609% | 26,743 | 2.599% |
| 100 to 999 | 43,536 | 2,140 | 4.915% | 32,194 | 6.396% |
| 1,000 to 9,999 | 20,523 | 1,479 | 7.207% | 16,619 | 8.629% |
| 10,000 to 99,999 | 6,537 | 541 | 8.276% | 5,562 | 9.547% |
| 100,000 or more | 2,054 | 286 | 13.924% | 1,840 | 15.435% |
Ten streams in the cohort had no matching channel record and appear nowhere in that table. The gradient has a mundane explanation: bigger channels stream longer and get sampled more, so they have more chances to switch. The four-or-more-samples column partly removes that, and the Twitch channel directory carries the per-channel size distribution behind it.
Switch timing, and whether streamers come back
The median first switch on the 2026-09-05 cohort came 184.7 minutes into the broadcast, with a quartile range of 109.6 to 287.9 minutes. Category changes are a late-stream event, not an opening move, and that alone rules out the idea that switching is mostly people fixing a mislabelled start.
Most switchers switch once. Of 5,252 switching streams, 4,278 (81.5 percent) made a single change, 725 made two, and 249 made three or more. Only 335 of them, 6.38 percent, ended the stream in the category they began it in. So a category change is usually a one-way move rather than an excursion: the streamer leaves and stays gone. The 6,637 switch events across those 5,252 streams average 1.26 changes per switching stream.
Is there a standard switch route, like ending in Just Chatting?
No, and the folklore about ending every stream in Just Chatting does not survive contact with the data we can see. Across three UTC days, 2026-09-03 to 2026-09-05, we logged 18,964 category changes on 14,970 streams, spread over 1,206 distinct origin categories and 1,205 distinct destinations. The single most common route, Honkai: Star Rail into Zenless Zone Zero, accounts for 48 of them. That is 0.25 percent of all switches. There is no playbook here, just 15,000 people each doing their own thing.
| From category | To category | Switch events |
|---|---|---|
| Honkai: Star Rail | Zenless Zone Zero | 48 |
| Zenless Zone Zero | NTE: Neverness to Everness | 42 |
| Zenless Zone Zero | Honkai: Star Rail | 37 |
| Stalzone | STALZONE | 34 |
| Bombanana! | BOMBANANA! | 29 |
| Mario Kart 8 Deluxe | Mario Kart World | 25 |
| Path of Exile 2 | Path of Exile | 23 |
| Just Chatting | Minecraft | 20 |
| Genshin Impact | Honkai: Star Rail | 20 |
| Special Events | The Blood of Dawnwalker | 20 |
| MLB The Show 18 | MLB The Show 26 | 18 |
| VALORANT | League of Legends | 15 |
Two rows there need flagging. Stalzone and Bombanana are the same categories renamed by the platform, caught by our sampler as a change in capitalisation. We counted 63 such case-only pairs out of 18,964 events, 0.33 percent, small enough to leave in and dishonest to leave undocumented. The rest of the top of the table is franchise adjacency: sequels, ports and companion titles from one publisher. Switchers mostly switch sideways, which fits how category demand clusters in our measurement of Twitch category competition and moves week to week in the Twitch category trend tracker.
The limits of a category shelf crawl
This is the part most articles built on live-listing scrapes leave out. Our Twitch sampler walks the category list and takes roughly the top thirty streams in each category on each sweep, then repeats every fifteen minutes or so. On 2026-09-05 that produced 1,787 categories, a median of 125 samples and 15 distinct streams per category, and a hard ceiling of 2,924 samples for the busiest one. The consequence is that we observe the top slice of every category rather than a random sample of Twitch.
| Category | Distinct streams seen, 2026-09-05 | Samples | Median viewers | Lowest viewers seen |
|---|---|---|---|---|
| Just Chatting | 313 | 2,740 | 2,158 | 5 |
| Counter-Strike | 368 | 2,611 | 555 | 0 |
| Fortnite | 313 | 2,665 | 360 | 1 |
| Minecraft | 297 | 2,717 | 298 | 2 |
| Grand Theft Auto V | 285 | 2,672 | 513 | 1 |
| League of Legends | 242 | 2,802 | 932 | 0 |
| Special Events | 221 | 2,850 | 67 | 0 |
Just Chatting shows a median of 2,158 concurrent viewers in our sample because we only ever see its top forty or so channels at a time. That is not what Just Chatting looks like on Twitch. It is what the top of it looks like, and the same applies to every large category in the table. Anyone reading a category-share number off a shelf crawl of this kind is reading the crawler.
The direct casualty is the destination question. Only 209 of 18,964 switches in our three-day window ended in Just Chatting and 370 left it, which would make Just Chatting a net exporter. We do not believe that, and neither should you: a mid-sized streamer who moves into Just Chatting falls off the top-thirty shelf and disappears from our sample, so switches into crowded categories are censored by construction while switches into quiet ones stay visible. That finding is killed, not published. The same censoring makes our headline drop rate a floor rather than a ceiling, because the streams that vanish after switching are the ones most likely to have lost their audience. Our write-up of the fifteen-minute live sampler covers the cadence.
Does Kick behave the same way?
Kick streamers change category far more often, and it costs them less. On the same date, 2026-09-05 UTC, 11,177 of 101,174 Kick sessions changed category slug at least once, a rate of 11.05 percent against Twitch's 4.28 percent. On the four-or-more-samples cut it is 17.02 percent against 6.03 percent. Standardised the same way, a Kick switch is followed by a drop past 20 percent 18.88 percent of the time against a control rate of 14.13 percent, a ratio of 1.34x, from 15,955 switch intervals and 607,967 control intervals.
| Measure, 2026-09-05 UTC | Twitch | Kick |
|---|---|---|
| Streams or sessions in cohort | 122,761 | 101,174 |
| Changed category at least once | 4.278% | 11.047% |
| Same, 4 or more samples | 6.031% | 17.017% |
| Switch intervals measured | 4,958 | 15,955 |
| Drop over 20% after a switch | 17.09% | 18.88% |
| Drop over 20%, control intervals | 11.58% | 14.13% |
| Ratio | 1.48x | 1.34x |
Do not read the 2.6x gap in switch rates as a fact about streamer behaviour. The two crawls are built differently. Our Kick sampler covered 3,290 category slugs that day and recorded up to 26,412 distinct sessions inside a single one, while the Twitch sampler's largest category held 915 distinct streams. Kick coverage is closer to a census of who is live, so it catches small-channel switches the Twitch shelf never sees. The within-platform effects are comparable because each is measured against its own control. The cross-platform rate gap is not. Channel-level Kick figures sit in the Kick channel directory.
What does this mean if you are buying or selling a channel?
Category is a real part of what changes hands, and this data puts a number on how load-bearing it is. A channel above 100,000 followers ends the quarter-hour about 5 percent below where a comparable non-switching interval would have left it, and quadruples its chance of a bad quarter-hour. Buy one intending to repoint it at a different game and be clear about what we did and did not measure. This is the cost of a single mid-stream change, sampled a quarter-hour either side. Eight days of data cannot price a permanent move to a new category, and we are not going to pretend otherwise. Our comparison of follower count and concurrent viewers covers what that audience is worth.
The practical checks are short. Ask what share of the seller's last thirty days sat in one category. Ask whether the channel has switched primary category before and what happened to concurrent viewers when it did. If you are pricing a channel you already own, the Twitch channel valuation tool takes concurrent viewers rather than followers as its main input, which is the right way round for exactly this reason. Our category pages for gaming Twitch channels and Twitch channels with viewers set out what we escrow and what a listing has to evidence. Streaming supply is thin, and we would rather say so than imply otherwise: of 435 active listings on 2026-09-08, not one was a Twitch channel.
For sellers the read is more encouraging than the headline sounds. Four out of five switching streams switch once, only 6.38 percent come back, and the median stream loses nothing measurable. Moving your channel to a new game is a commit-or-do-not decision: there is no penalty at the median, and the streams that suffer are the ones with the most concurrent viewers to lose. Either way the record is public, so an inconsistent category history priced as a consistent one rarely survives due diligence on the marketplace listings.
Common questions about mid-stream category changes
Does changing category on Twitch reset your viewers?
No. Across 4,958 measured switch intervals on 2026-09-05, the median viewer ratio immediately after a category change was exactly 1.0000, meaning the typical stream carried its audience across unchanged. What changes is the spread: a drop past 20 percent occurred in 17.09 percent of switch intervals versus 11.58 percent of matched control intervals on streams that changed nothing.
How many Twitch streams change category while live?
Between 3.64 percent and 3.88 percent per UTC day across the six full days from 2026-09-02 to 2026-09-07, or 30,082 of 802,606 observed streams. Restricted to streams we sampled at least four times, the rate is 5.24 percent to 5.59 percent. Stitching streams across the midnight boundary raises the 2026-09-05 figure from 3.88 percent to 4.28 percent of 122,761 streams.
Do big channels lose more from switching than small ones?
Yes, by a wide margin. Channels above 100,000 followers saw a drop past 20 percent in 15.75 percent of switch intervals against 3.86 percent of their own control intervals, a ratio of 4.08x from 389 switch intervals. Channels under 1,000 followers saw 18.88 percent against 14.23 percent, only 1.33x. Large channels have steadier baselines, so a switch shows up against them clearly.
Do streamers switch because their viewers are already dropping?
Not on the evidence we have. For 4,323 switch transitions with a clean preceding interval, that preceding interval showed a drop past 20 percent 10.59 percent of the time, slightly below the 11.10 percent control rate from 859,832 intervals. The excess drop appears only in the interval containing the category change, which is what an event effect looks like rather than a continuation of an existing slide.
Do most streams end in Just Chatting?
A category shelf crawl cannot answer that honestly, and we are not going to pretend otherwise. Our sampler sees roughly the top thirty streams per category, so a mid-sized channel moving into a crowded category leaves the sample entirely. The 209 switches into Just Chatting counted across 2026-09-03 to 2026-09-05 are a floor set by our crawl design, not a measurement of Twitch.
How late in a stream does a category change usually happen?
The median first switch landed 184.7 minutes after the platform-reported start, with a quartile range of 109.6 to 287.9 minutes, measured on 5,252 switching streams from the 2026-09-05 cohort. Category changes are a late-broadcast event. Of those streams, 81.5 percent switched exactly once and only 6.38 percent finished in the category they started in.
Is switching more common on Kick than on Twitch?
It looks that way, 11.05 percent of 101,174 Kick sessions against 4.28 percent of 122,761 Twitch streams on 2026-09-05, but the two crawls differ. Kick coverage is broader, up to 26,412 sessions inside one category against a Twitch maximum of 915, so it catches small-channel switches the Twitch shelf misses. Treat the cross-platform rate gap as unresolved.
Related Articles
Continue learning with these related guides.
Does Twitch Account Age Still Matter? We Measured 432,192
Across 432,192 Twitch channels read on 2026-09-08, account age is almost pure accumulation, and at a matched follower count the newer channel wins.
X Bookmark Rate Benchmarks From 94,318 Scored Accounts
Half the X accounts we scored on ten or more posts bookmark under 0.0273% of their views, and a third of original posts get no bookmarks at all.