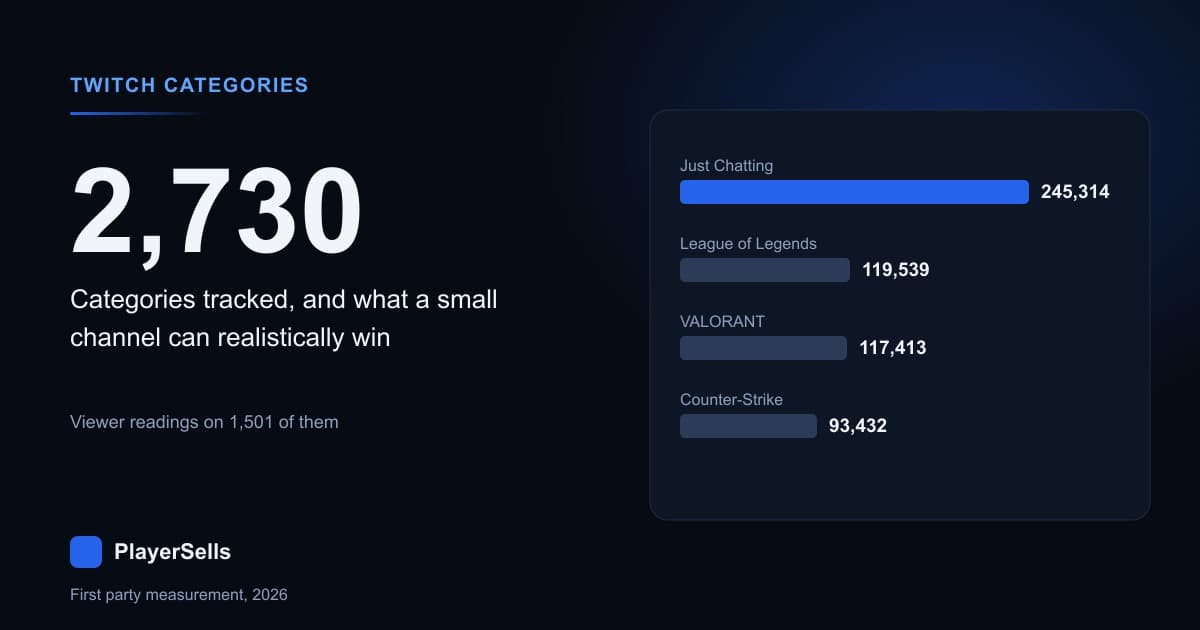
Just Chatting was the most watched Twitch category in our 2026 measurement, holding 245,314 concurrent viewers out of 1,979,640 counted across the 1,501 categories that carried a viewer reading when we swept the Twitch directory on 2026-09-02. The least contested categories are a completely different list, and it is a worse list than it looks. Across 61 directory sweeps that day, a median 87.0% of the categories with anyone live in them could not fill a 30-slot front page, and inside those open categories the single largest channel held a median 80.0% of every viewer in the category.
The honest answer to which Twitch category offers the most viewers for the least competition is that those two things do not come apart. Across 543 categories that never filled a front page and were live in at least 40 of our 61 sweeps, a front-page slot was worth a median of 4.5 concurrent viewers. In the 169 categories that filled their page in 40 or more of the same sweeps, it was worth 35.9. That is an 8.0x gap, pointing the wrong way for anyone hunting an empty room.
Which Twitch categories actually have the most viewers?
Our Twitch engine tracks 2,730 categories. Of those, 1,501 carried a viewer count at our final read on 2026-09-02 at 15:15 UTC and 1,229 did not. The ranking below is Twitch's own concurrent-viewer figure for each category, read at a single moment, alongside the number of distinct channels in our directory whose last recorded category was that one. Read the second column with suspicion. The next section explains why.
| Category | Viewers at 2026-09-02 15:15 UTC | Channels in our directory |
|---|---|---|
| Just Chatting | 245,314 | 1,316 |
| League of Legends | 119,539 | 521 |
| VALORANT | 117,413 | 571 |
| Counter-Strike | 93,432 | 603 |
| Grand Theft Auto V | 75,843 | 683 |
| World of Warcraft | 74,626 | 481 |
| Dota 2 | 52,483 | 445 |
| Pokemon Brilliant Diamond/Shining Pearl | 49,650 | 73 |
| Apex Legends | 46,684 | 572 |
| Crimson Moon | 36,786 | 325 |
| IRL | 35,885 | 346 |
| Dead by Daylight | 31,655 | 666 |
Category audiences are concentrated harder than most Twitch guides admit. Just Chatting alone took 12.4% of all 1,979,640 viewers we counted. The top five took 32.9%, the top ten 46.1%, the top twenty 59.0% and the top fifty 76.5%. At the other end, 658 of the 1,501 categories with a reading, or 43.8%, showed fewer than 10 viewers. Those shares are upper bounds, for a reason covered below: the directory understates small categories, shrinking the denominator.
| Slice of the category ranking | Share of the 1,979,640 viewers we counted |
|---|---|
| Top 1 (Just Chatting) | 12.4% |
| Top 5 | 32.9% |
| Top 10 | 46.1% |
| Top 20 | 59.0% |
| Top 50 | 76.5% |
| Remaining 1,451 categories | 23.5% |
Why neither column in a category table is category size
Our crawler reads each category's directory page every 15 minutes and takes the top 30 live channels from it. That is the whole mechanism, and it caps everything downstream. The channels-seen field on our category rows maxes out at exactly 30, and summed across all 2,730 categories it comes to 11,367 channel slots. Our channel table holds 127,349 channels with a last recorded category. The shelf therefore sees 8.9% of what the directory knows about, so a category's channels-seen value is a page size, not a population.
The obvious fix is to count channels by their last recorded category instead. We did, and that number is also not category size. Counter-Strike showed 93,432 concurrent viewers and 603 channels in our directory. Call of Duty: Mobile showed 78 concurrent viewers and 513 channels. The audiences differ by 1,198x while the channel counts differ by 1.18x. Nobody believes Call of Duty: Mobile has almost as many Twitch streamers as Counter-Strike. Both counts are compressed toward parity because both categories are read 30 channels at a time.
What that count measures is turnover on the shelf. A large category cycles different channels through its top 30 across sweeps, so we accumulate more distinct names. A small category shows us the same handful every time. The number is a crawl statistic wearing a census costume. To see the channels our engine does hold, the Twitch channel directory lists them with measured viewership rather than a self-reported figure.
Does a quiet category give a small channel a better chance?
This is the claim the category-picking advice industry runs on, and our data contradicts it. When a category's page came back with fewer than 28 channels, we had captured every channel live in it, which makes those observations a complete census rather than a sample. We logged 42,218 such category-sweep observations on 2026-09-02. The median one contained 2 live channels and 11 total viewers, the typical channel in it had 2 viewers, and the biggest channel held 80.0% of the category's entire audience.
Restricting to categories with a stable presence sharpens it. Among the 543 categories that never filled a page and appeared in at least 40 of our 61 sweeps, the median category delivered 4.5 viewers per front-page channel and its top channel held 68.2% of the viewers. Among the 169 categories that filled their page in 40 or more sweeps, the median delivered 35.9 viewers per front-page channel and its top channel held 24.7%. Low competition and low audience are the same measurement read from opposite ends.
| Measurement | Categories that never filled a page (n=543) | Categories that usually filled one (n=169) |
|---|---|---|
| Viewers per front-page channel, median | 4.5 | 35.9 |
| Share of category viewers held by its top channel, median | 68.2% | 24.7% |
| Sweeps used, 2026-09-02 | 61 | 61 |
| Front-page slot | Automatic | Contested |
One caveat belongs in the same breath. The 35.9 figure covers the top 30 channels of a busy category, the best 30 of a much larger live field, while 4.5 covers every channel in an open one. Both are front pages, so the comparison holds for the value of a visible slot. It does not say a new channel walking into Counter-Strike gets 35.9 viewers. It says the slot is worth that much once won.
How many Twitch categories cannot fill a front page?
We ran this across all 61 sweeps of 2026-09-02 rather than one, because a single reading would mostly measure the hour of day. The median sweep found 1,001 categories with at least one live channel, ranging from 889 at 07:30 UTC to 1,145 at 02:30 UTC. Of those, a median of 131, or 13.0%, had 30 or more channels live at once. The extremes were 93 saturated categories (9.9%) at 06:45 UTC and 216 (19.3%) at 00:15 UTC. Saturation never approached a majority at any point.
Aggregated over the day, 1,602 distinct categories appeared in at least one of our sweeps. Of those, 1,286 (80.3%) never filled a front page even once, 147 filled one in some sweeps, and 169 (10.5%) filled one in 40 or more of the 61. The open shelf is not a niche. It is the overwhelming majority of Twitch's category tree, which is exactly why it is not an opportunity. An empty page is a page nobody browses.
What is a front-page slot worth in the biggest categories?
For the categories that do fill their page, the slot can be priced directly. The table below is measured across the 61 sweeps of 2026-09-02, restricted to sweeps where the category returned a full page. Front-page total is the combined concurrent viewership of those 30 channels. Typical front-page channel is the median among them, roughly what a channel that has just earned a slot can expect. The last column is the largest channel's share of the page.
| Category | Front-page total | Typical front-page channel | Largest channel | Top channel's share |
|---|---|---|---|---|
| Just Chatting | 93,799 | 1,996 | 14,524 | 14.4% |
| World of Warcraft | 39,399 | 337 | 15,062 | 40.8% |
| League of Legends | 32,921 | 677 | 7,320 | 22.2% |
| VALORANT | 24,792 | 463 | 7,404 | 20.6% |
| IRL | 21,230 | 379 | 2,959 | 15.2% |
| Escape from Tarkov | 19,021 | 224 | 5,306 | 29.5% |
| Teamfight Tactics | 18,113 | 202 | 5,798 | 40.5% |
| Apex Legends | 16,496 | 146 | 6,204 | 40.8% |
| Dead by Daylight | 11,604 | 142 | 3,535 | 24.8% |
| Overwatch | 10,347 | 176 | 1,998 | 17.5% |
| Minecraft | 7,981 | 125 | 2,251 | 29.6% |
The spread inside that table is the useful part. Just Chatting's typical front-page channel carried 1,996 concurrent viewers, 16x the 125 in Minecraft, which is a large category on any reading. World of Warcraft ran a front page worth 39,399 viewers where the top channel took 40.8% of it, against Just Chatting's 14.4%. Two categories can have similar audiences and completely different odds of that audience reaching you.
The lowest-ranked channel on a full page gives the entry price. Across sweeps where Just Chatting returned a full page, its 30th channel carried a median 492 concurrent viewers, and League of Legends carried 309. For mid-sized categories that floor jumps around between sweeps, because the directory occasionally seats a very small channel on the page, so we do not publish those figures. To turn a viewer number into money, our Twitch channel value estimator and the Twitch revenue calculator both take concurrent viewership as their input rather than follower count.
Who holds the viewers inside a Twitch category?
Concentration inside a category runs the opposite way to concentration across categories. In categories that never filled a page, the top channel held a median 68.2% of the audience, and across all 42,218 complete-census observations that figure was 80.0%. In categories that reliably fill a page, the top channel held a median 24.7%. Small categories are one-streamer categories. There is no long tail inside them to join, because the tail is where the viewers are not.
A few categories make this vivid. Our directory read 49,650 concurrent viewers in Pokemon Brilliant Diamond/Shining Pearl against 73 channels, and 24,983 in a category named Moo Who? where our sweep saw a single channel. These look extraordinary on a viewers-per-channel ranking and are useless as strategy: the viewers belong to one broadcast and leave with it. Any such score computed without checking who holds the viewers will promote exactly these cases.
The metric we measured and then threw away
Our first attempt at a competition score was the median measured viewership of the channels we hold in each category, which is the metric this kind of article usually publishes. It produced a clean-looking answer: Counter-Strike's median was 471 concurrent viewers and Call of Duty: Mobile's was 1, a 471x spread. We did not publish it, because it is our crawler talking rather than Twitch.
The reason is the 30-channel page. In a category with thousands of simultaneous streamers we record only the top 30, so our Counter-Strike sample is the elite of Counter-Strike. In a category with four streamers we record all four, including its 1-viewer channels. That median is therefore close to a restatement of category size, inverted. A second confound sits underneath it: partner channels ran a median 119 concurrent viewers against 7 for affiliates and 2 for unaffiliated channels, so a category median also restates the partner share of whoever was live.
That is worth stating plainly, because the number is attractive, wrong, and widely circulated. If you meet a category ranking built on the average or median viewership of the channels in each category, ask how deep into each category the data goes. If the answer is a fixed page depth, the ranking is measuring the page.
Where does the directory's own viewer count stop being trustworthy?
We checked Twitch's per-category viewer figure against our own channel-level count in the same 15-minute window, on 2026-09-02 at 15:00 UTC. For the 19 categories reading above 20,000 viewers, the front pages we captured held 62.6% of the reported total, which is the expected result for a page of 30 inside a much bigger field. For the 50 categories reading 5,000 to 20,000 it was 74.4%, and for the 95 reading 1,000 to 5,000 it was 91.6%. Below that the comparison breaks.
| Directory reading for the category | Categories | Front-page viewers as a share of the reading |
|---|---|---|
| 20,000 or more | 19 | 62.6% |
| 5,000 to 19,999 | 50 | 74.4% |
| 1,000 to 4,999 | 95 | 91.6% |
| 100 to 999 | 197 | 105.0% |
| Under 100 | 684 | 317.3% |
A front page cannot hold more viewers than its own category, so the last two rows are the column failing rather than a finding. The clearest case is Slots: the directory reported 24 concurrent viewers while our sweep in that same window counted 20,321 across 25 live Slots channels. Super Mario Bros. reported 1 viewer against 394 across 4 channels. We treat the category viewer figure as usable above roughly 1,000 viewers and unusable below, and every share quoted here comes either from readings above that line or from our own channel-level counts.
What category data changes for a Twitch channel buyer
Streaming inventory is priced on viewers rather than followers, which makes category a valuation input and not a stylistic detail. Two channels with identical follower counts sitting in Just Chatting and in Free Fire face front pages worth 93,799 and 31 concurrent viewers respectively, and that gap shows up in the earnings a buyer inherits. Before taking a seller's category claim at face value, check what the category was actually worth during the hours the channel streams.
Three things are worth verifying on any streaming listing. First, whether the channel's audience survives a category change, since a channel parked in a one-streamer category may be carrying its own audience rather than borrowing one. Second, whether the viewership figure quoted is a peak or an average, because those diverge by more than an order of magnitude in every category we measured. Third, whether the numbers are self-reported at all. Our Twitch follower rank checker and our live platform tracker read the same directory as this article, so a claim takes a minute to test.
Sellers face the mirror image. A channel whose viewership came from a category that has since emptied out is worth less than its follower count suggests, and one that holds its audience across category changes is worth more. Our seller listing flow asks for the viewer figures buyers pay against, current listings sit in the live marketplace, and the Twitch channel buying page shows what is available now.
How we measured this
Every figure here comes from our own Twitch crawl, which went live on 2026-09-01 at 12:57 UTC. It reads each category's directory page every 15 minutes and records the top 30 live channels with their concurrent viewership. On 2026-09-02 that produced 639,056 live sample rows across 61 sweeps between 00:00 and 15:00 UTC, following 545,117 rows on 2026-09-01. The channel directory held 127,631 records at our final read, of which 107,014 carried a measured average concurrent viewership. Category readings come from the same engine, last refreshed at 15:15 UTC.
Two limits deserve stating. The engine is two days old, so the columns in our schema named for a 30-day window are not 30-day figures: the longest airtime we hold for any channel is 25.50 hours and the median is 1.75, so those averages cover exactly two days. Nothing here is a growth, trend or churn claim. Separately, we only see channels that were live during a sweep, so a channel streaming outside our window is invisible regardless of size. For platforms where we hold real history, our analysis of what six million daily snapshots show about shrinking accounts covers how fast measured audiences move.
Where two formulations of the same question disagreed, we kept the more conservative one. Saturation measured from the category rows at a single sweep gave 20.7% of active categories filling a page, against 17.1% from the live samples in the nearest window, so we report the 61-sweep range of 9.9% to 19.3% rather than either point estimate. Category size is reported only where our page came back unfilled, the only case where our count is complete.
Questions about Twitch category data
What is the most watched category on Twitch?
Just Chatting, by a wide margin. Our sweep of the Twitch directory on 2026-09-02 at 15:15 UTC read 245,314 concurrent viewers in Just Chatting, which is 12.4% of the 1,979,640 viewers counted across all 1,501 categories carrying a reading. League of Legends was second at 119,539 and VALORANT third at 117,413. The gap between first and second was 125,775 viewers, larger than the entire audience of any category outside the top two.
Which Twitch categories have the least competition?
Most of them, and that is the problem. Across 61 sweeps on 2026-09-02, a median 87.0% of the categories with any live channel had fewer than 30 channels live at once, so every one of those channels appeared on the category's front page automatically. In those categories the median total audience was 11 concurrent viewers and the largest channel held 80.0% of it. Low competition is a symptom of no audience rather than an opening.
How many categories does Twitch have?
Our engine tracks 2,730 and holds a viewer reading for 1,501 of them, measured 2026-09-02. Across a full day of sweeps we saw live channels in 1,602 distinct categories, and our channel table separately records 2,462 distinct last-played categories across 127,349 channels. None of those figures is Twitch's complete category list, which is far larger and includes categories nobody streams. They are what our crawl reaches.
How many concurrent viewers do you need to reach a category's front page?
It depends entirely on the category, and in most of them the answer is one. In the 1,286 categories that never filled a page during our 61 sweeps on 2026-09-02, any live channel was on the front page by default. In Just Chatting, the 30th-ranked channel carried a median 492 concurrent viewers across the sweeps where the page was full, and in League of Legends it carried 309. Between those extremes sits almost every category on the platform.
Is viewers per channel a good way to pick a Twitch category?
Not on its own. The categories that top a viewers-per-channel ranking are usually ones where a single broadcast holds nearly everything: across our 42,218 complete-census observations the top channel held a median 80.0% of the category's viewers. A ranking that ignores concentration promotes exactly those cases. Pair viewers per channel with the top channel's share, which was 24.7% in categories that fill their page and 68.2% in those that never do.
Can you use Twitch category data to value a channel?
As one input, yes. Streaming channels are priced on concurrent viewership rather than followers, and category sets a ceiling on how much borrowed audience a channel can reach: front pages in our measurement ranged from 93,799 concurrent viewers in Just Chatting down to 11 in the median open category. What category data cannot tell you is how much of a channel's audience is its own. That question needs the channel's own viewership history, not the category's.
Why do published Twitch category statistics disagree with each other?
Mostly because of sampling depth. Tools that read a fixed number of channels per category, as ours does at 30, produce category averages that track category size rather than category quality. Our own attempt at that metric gave Counter-Strike a median of 471 concurrent viewers against 1 for Call of Duty: Mobile, a 471x spread that is an artifact of how deep the page reaches. Any category ranking should state its depth, and most do not.
Related Articles
Continue learning with these related guides.
Does Twitch Account Age Still Matter? We Measured 432,192
Across 432,192 Twitch channels read on 2026-09-08, account age is almost pure accumulation, and at a matched follower count the newer channel wins.
X Bookmark Rate Benchmarks From 94,318 Scored Accounts
Half the X accounts we scored on ten or more posts bookmark under 0.0273% of their views, and a third of original posts get no bookmarks at all.