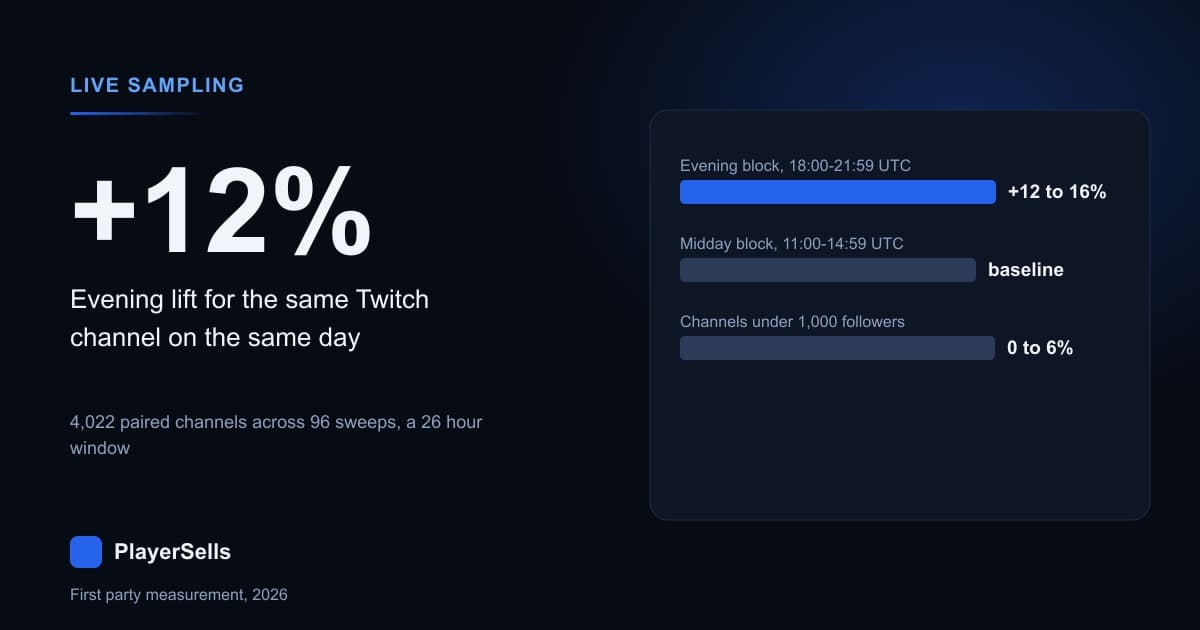
Between 2026-09-01 13:15 UTC and 2026-09-02 13:15 UTC we swept every live channel we could reach on Twitch once every 15 minutes and recorded 1,078,655 channel-level viewer readings across 108,473 distinct channels in 96 consecutive sweeps. The answer to the question in the title, measured inside the same channel on the same day: the 18:00 to 21:59 UTC block is worth 12% to 16% more viewers than the 11:00 to 14:59 UTC block for channels above 1,000 followers, and between 0% and 6% for channels below 1,000 followers. Hour of day is real. It is also far smaller than the advice industry sells.
The population-level swing looks far more dramatic than the individual one, and that gap is the whole article. Across our 24-hour rotation the concurrent audience on the channels we sampled moved from 694,786 viewers at 07:00 UTC to 1,795,776 at 20:00 UTC, a factor of 2.58. Live channel count at those same moments moved only from 8,580 to 13,275, a factor of 1.55. Demand swings almost twice as hard as supply, and most of the extra audience lands on channels that were already large.
How we measured a full day of Twitch
Our streaming engine polls Twitch's live surface on a fixed 15-minute cron, firing at :09, :24, :39 and :54 past the hour in the day we analysed. Each sweep finished in roughly 60 to 90 seconds, so a sweep is close to an instantaneous snapshot rather than a crawl smeared across an hour, and one sample equals exactly 15.00 minutes of confirmed airtime. We took the window 2026-09-01 13:15 UTC to 2026-09-02 13:15 UTC because it is exactly one rotation of the clock: 96 sweeps, four in every one of the 24 hours.
The crawl is not rank-truncated. In every hour the lowest viewer count we recorded was 0, and in a single peak sweep we logged 2,003 channels sitting at exactly 1 viewer, against 2,098 at 1 viewer in a trough sweep. A crawler that stopped after the top N pages would show a cliff at the bottom of the ladder. Ours shows a smooth decay to zero at both peak and trough, which is what makes hour-to-hour comparison legitimate. All 108,473 channels we saw live are carried in our Twitch directory, which held 127,327 channels at the time of this measurement.
What we cannot prove is complete enumeration. We reach the bottom of the ladder we are served, but cannot demonstrate we see every channel live at a given instant, so every absolute total here is a sample total and a floor for the platform. The ratios are the publishable part: one sampler, one method, 15 minutes apart.
Two further limits. This window cannot support a weekday claim: our sampler went live on 2026-09-01 and the entire series is 26 hours of wall clock. Each clock hour is covered once, apart from 13:00 and 14:00 UTC, covered twice, which we use below as a replication test. It also cannot see a stream that began and ended between two sweeps, so sessions under 15 minutes are invisible and our session lengths are biased upward.
Is the hourly pattern real or is it our own crawler?
We tested that two ways. The first is cadence. All 96 expected sweeps landed, four per clock hour, with no gaps. Between one sweep and the next 15 minutes later, the number of live Twitch channels changed by a median of 0.91% and the viewers-per-live-channel figure changed by a median of 1.92%, measured across 103 consecutive sweep pairs. A series that moves under 1% every quarter hour is measuring something stable.
The second test is replication. Our window overlaps itself: seven quarter-hour slots between 13:15 and 14:45 UTC were sampled on both 2026-09-01 and 2026-09-02. Measured at the same clock slot on two different days, viewers per live channel agreed to within 1.24% to 5.35%, a mean absolute difference of 2.79%. Day-to-day noise of roughly 3% sits an order of magnitude below the 84% peak-to-trough swing described next. One rotation is still one rotation, and we would not defend any single hour to the decimal.
When is the Twitch audience actually biggest?
The table below is the core measurement: for each UTC hour, the average across that hour's four sweeps of channels live, viewers watching, and viewers per live channel. Everything comes from our own crawl of the live surface, not from a third-party top list.
| Hour (UTC) | Channels live | Viewers in sample | Viewers per live channel | Median viewers per live channel | Channels over 100 viewers |
|---|---|---|---|---|---|
| 00 | 12,999 | 1,177,925 | 90.6 | 7.0 | 1,425 |
| 01 | 12,951 | 1,077,698 | 83.2 | 7.0 | 1,385 |
| 02 | 12,711 | 1,020,171 | 80.3 | 7.0 | 1,331 |
| 03 | 12,036 | 1,013,160 | 84.2 | 6.3 | 1,256 |
| 04 | 11,224 | 921,349 | 82.1 | 6.0 | 1,144 |
| 05 | 10,327 | 767,492 | 74.3 | 6.0 | 1,061 |
| 06 | 9,548 | 707,168 | 74.1 | 6.0 | 1,046 |
| 07 | 8,894 | 694,786 | 78.1 | 6.0 | 1,044 |
| 08 | 8,653 | 839,531 | 97.0 | 6.5 | 1,064 |
| 09 | 8,580 | 927,202 | 108.1 | 7.0 | 1,097 |
| 10 | 8,689 | 1,034,914 | 119.1 | 7.0 | 1,154 |
| 11 | 9,025 | 1,159,886 | 128.5 | 7.0 | 1,240 |
| 12 | 9,740 | 1,165,787 | 119.7 | 7.0 | 1,340 |
| 13 | 10,247 | 1,201,092 | 117.2 | 7.0 | 1,474 |
| 14 | 11,159 | 1,344,562 | 120.5 | 7.0 | 1,627 |
| 15 | 11,261 | 1,419,248 | 126.0 | 7.8 | 1,688 |
| 16 | 11,757 | 1,522,156 | 129.5 | 8.0 | 1,740 |
| 17 | 12,400 | 1,611,981 | 130.0 | 8.0 | 1,809 |
| 18 | 12,879 | 1,725,365 | 134.0 | 8.0 | 1,858 |
| 19 | 13,275 | 1,791,898 | 135.0 | 8.0 | 1,872 |
| 20 | 13,191 | 1,795,776 | 136.1 | 8.0 | 1,847 |
| 21 | 12,861 | 1,643,477 | 127.8 | 7.5 | 1,742 |
| 22 | 12,597 | 1,462,419 | 116.1 | 7.0 | 1,607 |
| 23 | 12,663 | 1,309,802 | 103.4 | 7.0 | 1,506 |
The median column averages the four sweep medians in each hour, hence the fractions. Across all 96 sweeps a live Twitch channel sat in a market of 108.78 viewers per live channel. The ratio peaked at 136.1 at 20:00 UTC and bottomed at 74.1 at 06:00 UTC, a spread of 1.84x. Read that quickly and you get the standard conclusion: stream in the evening, avoid the small hours. Read the median column instead and the effect nearly disappears. The median live channel had 8 viewers at the busiest hours and 6 at the quietest. Two viewers.
Does the audience grow faster than the supply of streams?
Yes, by a wide margin. Between the 07:00 UTC trough and the 20:00 UTC peak our sample gained 1,100,990 concurrent viewers, an increase of 158%. Over the same 13 hours the number of live channels rose by 4,297, an increase of 48%. Audience is more than three times as elastic across the day as supply.
That is also why 108,473 channels went live across our window while only 13,363 were ever on air simultaneously, our highest single-sweep reading. The live population is a fast-turning queue, not a standing army: the count of channels broadcasting in a day runs about eight times the count visible at any moment. Our Twitch channel directory ranks the same channels by measured concurrent viewers rather than by follower count.
When do streamers actually press go live?
We identified 115,506 distinct Twitch broadcasts that started inside our 24-hour window, keyed on stream ID and timestamped by the platform's own start field. Comparing each hour's share of the day's stream launches against that hour's share of the day's viewing gives a contest index: above 1.00 means the audience is there in greater proportion than the streams competing for it. Both sides are shares of our own sample, so the index is unaffected by whether we enumerate the platform completely.
| Hour (UTC) | Share of day's viewing | Stream launches | Share of day's launches | Audience per launch index |
|---|---|---|---|---|
| 20 | 6.12% | 5,301 | 4.59% | 1.33 |
| 19 | 6.11% | 5,902 | 5.11% | 1.20 |
| 10 | 3.53% | 3,388 | 2.93% | 1.20 |
| 23 | 4.47% | 6,343 | 5.49% | 0.81 |
| 02 | 3.48% | 5,453 | 4.72% | 0.74 |
| 01 | 3.67% | 5,981 | 5.18% | 0.71 |
| 00 | 4.02% | 6,488 | 5.62% | 0.71 |
The most crowded launch hour is 00:00 UTC, with 6,488 broadcasts starting against only 4.02% of the day's viewing. The least crowded relative to audience is 20:00 UTC, with 5,301 launches against 6.12% of the viewing. The 22:00 to 02:00 UTC block is oversupplied by roughly 1.9x relative to the 19:00 to 21:00 UTC block, which is the opposite of the folk advice that says to dodge prime time.
Does going live in the evening actually get you more viewers?
The numbers above compare different channels at different hours, which is the mistake that has fooled every "best hour to stream" post we have read. The fix is a paired test: take only channels live in both blocks during the same 24 hours, and compare each channel against itself. We ran it two ways to check the result is not an artifact of one specification.
| Follower band | Paired channels (spec A) | Evening lift (spec A) | Paired channels (spec B) | Evening lift (spec B) |
|---|---|---|---|---|
| Under 1,000 | 2,050 | +0.0% | 1,912 | +6.2% |
| 1,000 to 9,999 | 1,025 | +12.2% | 1,000 | +13.9% |
| 10,000 to 99,999 | 642 | +16.1% | 618 | +14.1% |
| 100,000 or more | 305 | +12.6% | 300 | +12.5% |
| All paired channels | 4,022 | +4.4% | 3,830 | +10.3% |
Specification A takes each channel's median viewers across 11:00 to 14:59 UTC and 18:00 to 21:59 UTC, requires at least two sweeps in each block, and reports the median per-channel ratio. Specification B uses means, widens the blocks to 10:00 to 15:59 and 18:00 to 22:59, and requires four sweeps in each. Above 1,000 followers the two agree closely at a 12% to 16% evening premium. Below 1,000 followers they do not agree at all, which is itself the finding: the daypart effect on a small channel is small enough that its sign is not stable across two reasonable ways of asking.
A channel with fewer than 1,000 followers had a median live audience of exactly 3 viewers in 22 of the 24 hours of the clock, rising to 3.5 at 19:00 UTC. Choosing a different hour is not the lever. Note what the paired test requires: a channel had to be live in both blocks, which selects for long or twice-daily broadcasters, roughly 4,000 of the 108,473 channels we saw. Our Twitch earnings calculator works from concurrent viewers rather than followers, which is the number that converts.
Why the midday result was wrong, and how we caught it
Our first pass had a different headline. Stratified by follower band, the cross-sectional data says the 1,000 to 9,999 band has its best median audience at 14:00 UTC, with 26.5 median viewers across 2,486 live channels, against 23.75 median viewers across 3,157 live channels at 20:00 UTC. More audience per channel, 21% fewer competitors. It looked like a clean contrarian result: the underserved window is midday UTC, not the evening.
The paired test killed it. The same channels measured in both blocks did 12.2% to 13.9% better in the evening. The midday advantage was a selection effect, not a time effect: the channels that choose to broadcast at 14:00 UTC are stronger inside their follower band than the ones that broadcast at 20:00 UTC. Cross-sectional hour-of-day comparisons produce this error every time. We publish the kill because the process matters more than the number.
How long is a Twitch stream?
We reconstructed 104,386 complete broadcasts: sessions that began after our window opened and left the live surface before it closed. Duration runs from the platform's own start timestamp to the last sweep in which the stream was still up, so it resolves to within 15 minutes and understates slightly.
| Median viewers during session | Sessions | P25 hours | Median hours | P75 hours | P90 hours |
|---|---|---|---|---|---|
| 0 | 5,571 | 0.18 | 0.46 | 0.99 | 1.80 |
| 1 to 9 | 68,601 | 0.83 | 1.74 | 2.99 | 4.51 |
| 10 to 99 | 23,563 | 2.05 | 3.18 | 4.62 | 6.49 |
| 100 to 999 | 5,846 | 2.10 | 3.64 | 5.41 | 7.49 |
| 1,000 or more | 805 | 2.58 | 4.22 | 6.02 | 7.98 |
| All sessions | 104,386 | 0.95 | 2.05 | 3.54 | 5.30 |
The median Twitch broadcast in our sample ran 2.05 hours, the 90th percentile ran 5.30 hours, and the longest completed session we caught ran 22.84 hours. Session length is associated with audience size in a clean monotone way: median duration rises from 1.74 hours for streams averaging 1 to 9 viewers to 4.22 hours for streams averaging 1,000 or more, a factor of 2.4. We cannot say which direction that runs from one rotation of cross-sectional data.
How much of the day is a channel actually live?
Airtime is the other half of the schedule question, and here it is measured rather than inferred. Because samples are exactly 15.00 minutes apart, every sweep in which a channel appeared is a quarter hour of confirmed airtime, so sample count measures time on air rather than crawler effort.
| Median viewers in window | Channels | Median hours live | P75 hours | P90 hours | Live 12h or more |
|---|---|---|---|---|---|
| 0 | 4,205 | 0.75 | 1.25 | 2.50 | 5 |
| 1 to 9 | 69,088 | 1.50 | 2.75 | 4.25 | 618 |
| 10 to 99 | 27,035 | 2.50 | 4.00 | 6.00 | 402 |
| 100 to 999 | 7,084 | 3.25 | 5.50 | 8.00 | 252 |
| 1,000 or more | 1,061 | 4.25 | 6.50 | 9.00 | 57 |
| All channels | 108,473 | 1.75 | 3.25 | 5.25 | 1,334 |
The median channel that went live at all was on air for 1.75 hours. Only 1,334 of 108,473 channels, or 1.23%, were live for 12 hours or more, and 12,482 channels, or 11.5%, appeared in exactly one sweep and were gone. A channel averaging 1,000 or more viewers was live for a median of 4.25 hours, 2.8x the airtime of a channel averaging 1 to 9. Consistency of airtime separates the tiers far more sharply than choice of hour does.
Why we will not publish Kick's clock
We run the identical 15-minute sampler against Kick and captured 418,752 samples on 2026-09-01 and 433,305 on 2026-09-02. We are not publishing an hour-of-day curve from it, and the reason is worth showing rather than asserting.
| Stability check | Twitch | Kick |
|---|---|---|
| Sweeps landed of 96 expected | 96 | 94 |
| Median change in live channels between consecutive sweeps | 0.91% | 27.76% |
| Median change in viewers per live channel between consecutive sweeps | 1.92% | 33.07% |
| Largest change in viewers per live channel between consecutive sweeps | 12.3% | 5,853.8% |
| Highest sweep divided by lowest, live channels | 1.56x | 3.56x |
| Worst disagreement at the same clock slot on two days | 5.4% | 149.6% |
A platform's live channel count cannot genuinely move 27.76% as a median every quarter hour. Kick's sampler drops pages under rate limiting and sometimes misses a sweep entirely, so what looks like a Kick daypart curve is mostly our own collector breathing. Kick's cross-sectional shape is measurable and we publish it elsewhere. Its clock is not. Anyone valuing a channel there should work from the cross-sectional distribution, which is what our Kick channel valuation tool uses, and see what is actually for sale on the Kick channel listings page.
What does this mean if you are buying or selling a channel?
First, a channel's concurrent viewer figure is only comparable against another's if you know which hours each was on air: viewers per live channel across our sample ranges from 74.1 to 136.1 by hour. A seller quoting an average built from 19:00 to 21:00 UTC sessions is quoting the richest part of the clock.
Second, airtime is verifiable and follower count is not. A channel holding 3 to 4 hours of daily airtime sits in the top quartile of everything we measured, and unlike followers it shows up in any sampled history. Assessing a listing on our account marketplace, or preparing one on the seller listing page, hours live per day is the harder number to fake.
Third, the 12% to 16% evening premium for channels above 1,000 followers is real but bounded, and it does not exist below that threshold. Do not pay extra for a small channel on the theory that a schedule change will unlock it. Our Twitch channel valuation tool prices on concurrent viewers for exactly this reason, and the current Twitch channel listings show what those viewers trade for. The logic in our analysis of what the data shows about the best time to post on X holds here: the timing effect is measurable, and much smaller than the effect of doing the thing more often.
Common questions about when to stream on Twitch
What is the best time to stream on Twitch?
Measured inside the same channel across our 24-hour window, the 18:00 to 21:59 UTC block returned 12% to 16% more viewers than the 11:00 to 14:59 UTC block for channels above 1,000 followers, across 1,972 paired channels. For channels below 1,000 followers the same test returned between 0% and 6% depending on specification, which is not a reliable signal. Viewing across our sample peaks at 20:00 UTC at 1,795,776 concurrent viewers.
Is it easier to get noticed by streaming at 3am?
No. In our 96-sweep measurement the quietest hours are the least rewarding per channel: at 06:00 UTC, 9,548 live channels shared 707,168 viewers, or 74.1 per live channel, against 136.1 at 20:00 UTC. Competition falls off-peak but the audience falls faster. The 00:00 to 02:00 UTC block is the most oversupplied window we measured, carrying 5.62% of launches against 4.02% of viewing.
How long should a Twitch stream be?
The median completed broadcast in our sample of 104,386 sessions ran 2.05 hours, and the 75th percentile ran 3.54 hours. Streams averaging 1,000 or more viewers ran a median of 4.22 hours against 1.74 hours for streams averaging 1 to 9 viewers. That relationship is associational: one rotation of cross-sectional data cannot separate longer sessions attracting viewers from established channels choosing to stream longer.
How many channels are live on Twitch at once?
Our highest single sweep recorded 13,363 channels live simultaneously and our lowest 8,548, from a directory of 127,327 tracked Twitch channels. Across the 24-hour rotation 108,473 distinct channels went live at least once. These are sample counts and a floor for the platform, since we cannot prove we reach every live channel, but the ratio matters: the live population turns over roughly eight times a day.
Does day of the week matter for streaming?
We cannot answer that and neither can anyone quoting our data. Our streaming sampler went live on 2026-09-01, so the entire series is 26 hours of wall clock, of which 24 hours form one complete rotation. A weekday claim needs several weeks of matched hours to separate weekday from hour of day. Any published day-of-week streaming statistic built on less than that is describing a single day.
Why do the population-wide numbers swing more than individual channels?
Because the extra evening audience is concentrated at the top. Viewing across our sample moved 2.58x over the window while live channel count moved only 1.55x, yet the median live channel went from 6 viewers at the quietest hours to 8 at the busiest. Channels over 100,000 followers averaged 1,169 viewers at 07:00 UTC and 1,895 at 19:00 UTC. Aggregate ratios are pulled by the largest streams and should never be read as a per-channel forecast.
How often does your sampler run and what does it miss?
Every 15 minutes, firing at :09, :24, :39 and :54 in the window we analysed, each sweep completing in about 60 to 90 seconds. All 96 expected sweeps landed. The main blind spot is any broadcast shorter than the sweep interval, which we never see, so session length figures are biased upward. We also cannot observe a channel offline for the whole window, so airtime figures describe only the 108,473 channels that went live at all.
Related Articles
Continue learning with these related guides.
Does Twitch Account Age Still Matter? We Measured 432,192
Across 432,192 Twitch channels read on 2026-09-08, account age is almost pure accumulation, and at a matched follower count the newer channel wins.
X Bookmark Rate Benchmarks From 94,318 Scored Accounts
Half the X accounts we scored on ten or more posts bookmark under 0.0273% of their views, and a third of original posts get no bookmarks at all.