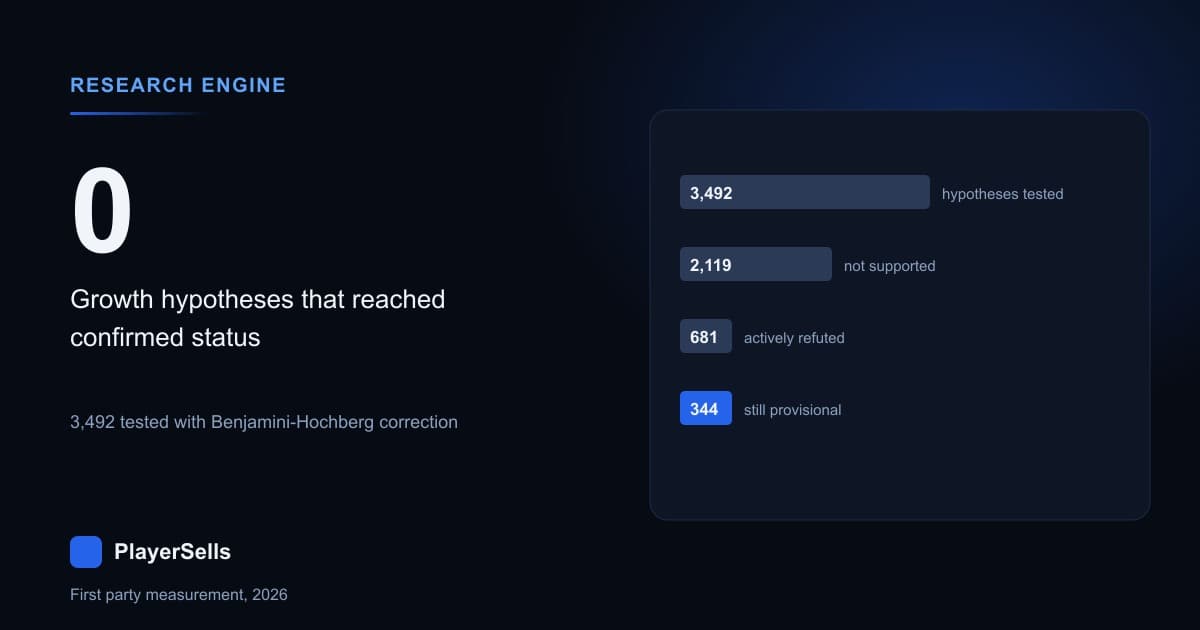
Our X research engine generated and tested 3,492 hypotheses about what makes a post perform, measured across 201,968 original posts from 3,294 accounts in the 90 days ending 2026-08-19. 344 of them cleared every publication gate. Zero were promoted to confirmed. 681 were actively refuted, which in this system means the measured effect was pinned inside plus or minus 10 percent and the claim was ruled out rather than left open. The remaining 2,119 were recorded as not supported.
Those hypotheses are a machine-generated sweep of the claims the social media growth industry repeats, and what survived is narrow. What you attach to a post moves engagement by tens of percent. When you post it does not. Timing hypotheses passed at 2.3 percent (41 of 1,780 tests) while post-composition hypotheses passed at 21.5 percent (197 of 916). Against engagement per impression, the metric least contaminated by how long a post has been live, our engine ran 445 timing tests in 2026 and none survived.
How does an automated hypothesis engine decide what to publish?
The engine enumerates a hypothesis space, estimates every cell, then puts each result through five gates in a fixed order, recording the first gate a test failed so a rejection carries information rather than just a verdict. Two sample floors come first: a bucket needs at least 50 distinct accounts and 500 posts. Then Benjamini-Hochberg false-discovery-rate correction at alpha 0.05. Then a minimum effect of 10 percent, applied to the confidence interval bound nearest zero rather than the point estimate. Then a split-half replication across accounts.
One correction to how this is usually described: the intervals are not bootstrap intervals. Each test reduces to a per-account paired log-ratio, takes a Hodges-Lehmann style median of those differences, and builds a distribution-free 95 percent interval from the order statistics at k and n plus 1 minus k. The p-value is a sign test on how many accounts moved up against how many moved down. The table below records the first gate that stopped each of the 3,492 tests, so its counts sum to the whole run.
| Gate the test failed first | Tests | Share of 3,492 | What it means |
|---|---|---|---|
| False-discovery correction | 1,813 | 51.9% | q above 0.05 after Benjamini-Hochberg within its family |
| Effect too small | 546 | 15.6% | Significant, but the interval reached inside plus or minus 10% |
| Passed all five gates | 344 | 9.9% | Recorded as provisional |
| Redundant direction | 304 | 8.7% | The mirror image of another test in the same dimension |
| Under 500 posts | 252 | 7.2% | The bucket never had enough evidence to test |
| Under 50 accounts | 212 | 6.1% | Too few independent accounts to compare |
| Split-half too weak | 21 | 0.6% | The weaker account half was not significant on its own |
The split-half gate is the part most analyses skip. Accounts are assigned to one of two halves by a stable hash of the account id, so the same account lands in the same half on every run. A finding has to point the same direction in both halves, and the weaker half has to clear an uncorrected 5 percent on its own. That separates a real pattern from forty accounts behaving oddly at once.
Why did zero hypotheses get promoted to confirmed?
Because promotion requires three consecutive passing runs, and only one run has ever completed. Every one of the 3,144 findings carries a tested-run count of 1, a drift state of "new", and a null previous effect size. Zero promoted is not a verdict on the hypotheses. It is arithmetic: the promotion rule cannot be satisfied by a single pass, by design, and the engine has passed once.
A second run was attempted on 2026-08-31 and failed. It tried to widen the pool from 3,294 accounts to 33,266 and from 201,968 posts to 1,595,070, hit a temporary-file size limit, and produced zero tests. The honest state as of 2026-09-02 is one successful pass plus one failed attempt at a bigger one. There is no drift data, and any claim about whether these effects hold over time would be invented.
The single run still supports the negative half of the ledger. A refutation does not need repetition in the way a promotion does, because a refutation is a bounded measurement rather than a discovered pattern that might be noise. 681 hypotheses were bounded on 2026-08-19. That is the durable part of this run.
What is the difference between "not supported" and "refuted"?
Most published analysis conflates two different statements: "we measured this and it does not matter" and "we did not have enough data to tell". The engine separates them with equivalence testing. A finding is refuted when the entire 95 percent interval sits inside the smallest effect worth acting on, set at 10 percent. That is the confidence-interval form of a TOST equivalence test, run against a 95 percent interval rather than the 90 percent one it strictly requires, which makes equivalence harder to claim.
The numbers separate cleanly. All 681 refuted findings have their whole interval inside plus or minus 10 percent, with a median absolute effect of 1.95 percent and a median interval width of 8.67 points. The 2,119 not-supported findings have a median interval width of 22.41 points, and only 2 of them sit fully inside the band. Those are not the same result wearing different labels.
| Status | Findings | Share | Median absolute effect | Median 95% interval width |
|---|---|---|---|---|
| Not supported | 2,119 | 67.4% | 7.21% | 22.41 points |
| Refuted (bounded under 10%) | 681 | 21.7% | 1.95% | 8.67 points |
| Provisional (passed once) | 344 | 10.9% | 28.71% | 15.16 points |
| Promoted to confirmed | 0 | 0.0% | not applicable | not applicable |
Which social media growth myths were debunked by our data?
The timing myths, comprehensively. We tested 1,780 hypotheses about when to post across six dimensions; 41 passed, a rate of 2.3 percent, and 542 were refuted outright. Hour of day is the most repeated social media growth claim in the set and the most-tested here at 1,056 tests, and 3 survived. All 3 are the same hour, 22:00 UTC, inside a single follower decile, and all 3 point downwards. That is not a best time to post, and we do not trust it, for reasons below.
Part of day is the cleanest result in the run: zero of 112 tests passed and 102 were refuted, a rate of 91.1 percent, with effects spanning only minus 5.4 to plus 7.8 percent. Afternoon posting changed engagement per impression by minus 2.26 percent, interval minus 3.57 to minus 0.83, across 70,402 posts from 3,167 accounts. Monday changed it by minus 0.23 percent, interval minus 1.57 to plus 1.15, across 41,237 posts from 3,087 accounts.
| Timing dimension | Tests | Passed | Pass rate | Refuted | Median absolute effect |
|---|---|---|---|---|---|
| Hour of day (UTC) | 1,056 | 3 | 0.3% | 197 | 3.9% |
| Day of week | 308 | 30 | 9.7% | 100 | 5.6% |
| Gap since your last post | 224 | 2 | 0.9% | 110 | 4.0% |
| Part of day | 112 | 0 | 0.0% | 102 | 2.1% |
| Position in the day's posts | 48 | 0 | 0.0% | 25 | 4.4% |
| Weekend or weekday | 32 | 6 | 18.8% | 8 | 6.5% |
Day of week is the exception worth naming rather than hiding: it passed at 9.7 percent and weekend at 18.8 percent, so the calendar is not debunked the way the clock is. Our measurement of when X activity peaks across the day answers a different question, describing when attention is available, while this engine asks whether moving an account's own posts changes what they do. Read the posting time tool as a scheduling convenience, not a growth lever.
What actually survived the gates?
The 344 survivors are largely one finding in several vocabularies: attachments help, outbound links hurt, and tagging other people hurts. The largest effect in the run is media on short posts, at plus 131.3 percent bookmarks, interval plus 115.5 to plus 144.5, across 15,811 posts from 910 accounts. The rows below are the pooled form, all deciles together with no conditioning stratum, each clearing all five gates on 2026-08-19.
| Post property | Metric | Effect | 95% interval | Posts | Accounts |
|---|---|---|---|---|---|
| Link with no media | Engagement | -54.3% | -57.0 to -52.0 | 30,205 | 1,482 |
| Contains a link | Engagement | -52.3% | -54.5 to -49.7 | 50,922 | 2,199 |
| Contains a link | Engagement per impression | -38.8% | -40.3 to -36.9 | 50,907 | 2,199 |
| No media at all | Engagement per impression | -37.9% | -39.7 to -35.9 | 48,554 | 2,266 |
| Two or more mentions | Engagement | -34.9% | -38.8 to -29.1 | 7,288 | 1,071 |
| Any hashtag | Engagement | -19.8% | -24.2 to -16.0 | 41,469 | 1,863 |
| Video attached | Bookmarks | +67.5% | +60.9 to +74.2 | 56,965 | 2,763 |
| Media, no link | Engagement | +67.4% | +61.5 to +74.6 | 73,869 | 2,439 |
| Any media | Engagement per impression | +57.0% | +51.6 to +62.3 | 73,183 | 1,900 |
| Zero mentions | Engagement | +42.6% | +35.8 to +50.5 | 67,769 | 1,549 |
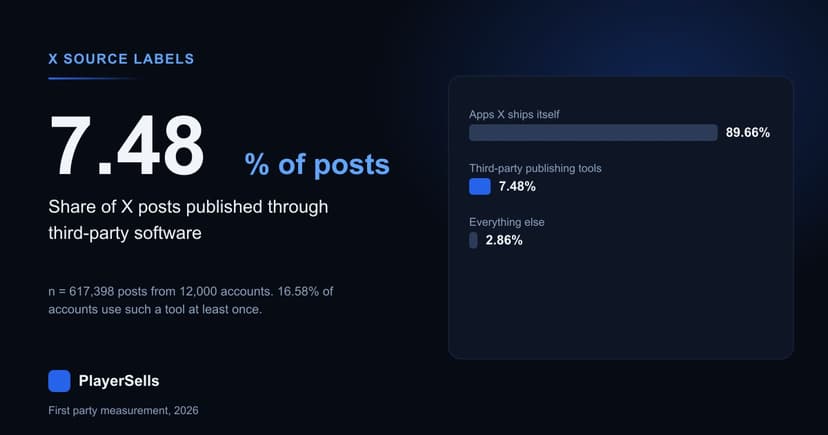
| Posted from the iOS app | Engagement | +35.9% | +29.5 to +43.3 | 35,599 | 1,774 |
| Posted via a scheduler | Engagement per impression | -20.7% | -25.6 to -16.3 | 19,035 | 672 |
Account-level agreement matters as much as the intervals. For the link-only result, 1,266 of 1,482 accounts individually moved down, or 85.4 percent. For video and bookmarks, 2,203 of 2,763 accounts moved up, or 79.7 percent. Anyone auditing one account before paying for it can rerun the same per-account comparison with our tweet analyzer on that account's recent posts.
Is the weekend effect real?
Partly, and the part that fails is the interesting one. Weekend posting passed on engagement at plus 18.7 percent (interval plus 16.4 to plus 21.1) and on reach at plus 17.2 percent (plus 15.0 to plus 19.3), across 47,138 and 47,136 posts from 2,883 accounts. On engagement per impression it measured plus 1.5 percent, interval plus 0.1 to plus 3.3, and was rejected as too small to matter.
Those three rows say the weekend buys distribution, not audience quality. More people see the post; the people who see it behave the same. Post spacing behaves identically: waiting over 24 hours since the previous post was associated with plus 13.4 percent reach (plus 10.5 to plus 16.6, across 21,038 posts from 1,835 accounts) while its engagement per impression moved minus 4.2 percent and failed the effect gate. Cadence moves how far a post travels, not what happens when it arrives.
Why is engagement per impression so hard to move?
Engagement per impression is the strictest of our four metrics and the most revealing. It passed on 56 of 873 tests, or 6.4 percent, against 13.3 percent for raw engagement, and produced 264 refutations, more than any other metric. Its survivors come almost entirely from media presence (15 passes), links (14), client type (9), post length (4), word count (4) and language (2).
Every timing dimension scored zero on this metric: hour of day 0 from 264 tests, day of week 0 from 77, post gap 0 from 56, part of day 0 from 28, day position 0 from 12, weekend 0 from 8. Hashtag dimensions also scored zero, 0 from 58 tests, even though hashtags moved raw engagement by minus 19.8 percent. That gap is the tell: hashtags change how far a post is distributed, not how the people reached respond.
| Metric | Tests | Passed | Pass rate | Refuted | Median absolute effect |
|---|---|---|---|---|---|
| Engagement | 873 | 116 | 13.3% | 93 | 9.12% |
| Bookmarks | 873 | 93 | 10.7% | 140 | 7.03% |
| Reach (impressions) | 873 | 79 | 9.0% | 184 | 6.61% |
| Engagement per impression | 873 | 56 | 6.4% | 264 | 4.58% |
How much did the multiple-testing correction actually matter?
A great deal, and the effect-size floor mattered more. Of the 3,492 tests, 1,386 came back significant at an uncorrected p of 0.05 or better, which is 39.7 percent of everything asked. Benjamini-Hochberg within families leaves 1,158. Adding only the sample floors to an uncorrected analysis would have yielded 1,319 findings. The 10 percent effect floor collapses that to 530, and the split-half plus the family-level correction leaves 344.
An analyst running the same 3,492 questions with a bare significance test would have published 3.8 times as many findings as this engine did, and called every one of them confirmed on the first pass. That ratio is the practical case for the ladder.
| Filter applied | Findings that survive | Share of 3,492 |
|---|---|---|
| Uncorrected p at or below 0.05 | 1,386 | 39.7% |
| Benjamini-Hochberg within family | 1,158 | 33.2% |
| Uncorrected p plus the sample floors | 1,319 | 37.8% |
| Plus the 10% minimum effect | 530 | 15.2% |
| All five gates, published as provisional | 344 | 9.9% |
| Promoted to confirmed | 0 | 0.0% |
One sensitivity is uncomfortable. Correcting across all 3,492 tests at once, instead of within each family, would have published 505 findings rather than 344. That choice of scope looks like housekeeping and moves the answer by 47 percent. Anyone quoting a corrected result without saying what it was corrected against is quoting half a number.
Who were these accounts, and does that limit the finding?
Severely, and this caveat travels with every number above. Our tweet-scan backfill takes the biggest unscanned accounts first, so every one of the 3,294 accounts in the 2026-08-19 run had at least 1,644,259 followers. This measures very large X accounts, not normal ones, and the effect sizes should not be transplanted onto an account with 5,000 followers. For where a normal account sits, our directory of ranked X accounts is the honest reference.
The engine does test inside follower deciles, but those are ten slices of a pool starting at 1.6 million followers, so decile 1 means the smallest tenth of a very large set. Within-decile tests passed at 7.0 percent (174 of 2,496) against 17.1 percent pooled (170 of 996). Most of that gap is power: the median pooled test used 10,498 posts and gave an interval 8.2 points wide, the median within-decile test 1,377 posts and 21.2 points.
Where could this measurement be wrong?
Hour of day and part of day are recorded in UTC, not the poster's local time. Because every test compares an account against itself, a fixed local offset is preserved inside each account, so the design can rule out a shared best hour on the UTC clock. It cannot rule out an account-specific best local hour. Post gap and day of week do not carry that weakness and refuted at similar rates, which is why the timing conclusion holds.
The three surviving hour-of-day results are exactly the shape an artifact would take: one hour, one decile, every metric pointing down, on 650 posts from 141 accounts. Engagement accumulates after publication, so any fixed crawl schedule can manufacture a spurious hour effect, and we are not treating those rows as a finding. Note the direction of that risk: our own instrument would have produced false hour effects, and the run produced almost none, which makes the timing null stronger.
Two more limits. The scheduler result overlaps heavily with the link result, since scheduled posts are disproportionately link posts, and only 168 interaction tests ran in this pass, none pairing client type with links. The mined tier, the hypotheses the engine invented from the data rather than a written list, passed at 22.2 percent against 7.6 percent for the pre-specified core tier. A higher pass rate for questions asked after seeing the data is expected, and is exactly why nothing is promoted on one run.
What should a buyer or seller do with 344 provisional findings?
Treat scheduling advice as low value and composition advice as measurable. The largest levers we found are all visible in an account's public timeline before you pay for it: whether it posts media, whether it dumps outbound links, whether it tags other accounts, and what client it posts from. Those are auditable in ten minutes. A claimed posting schedule is not.
For a buyer that changes the checklist. An account whose recent posts are mostly bare links is showing a timeline about 52 percent below its own media posts on engagement, and the price should reflect that pattern, not the follower count alone. Scoring it is what our post performance scorer is for, and the same reasoning underpins what a viral post does and does not prove about an account. The live account marketplace shows what sellers are asking.
Sellers get a shorter version: media in, links out, mentions down, and stop optimising the calendar. Anyone weighing that work against simply acquiring an audience should read the arithmetic in buying an X account versus growing one, and listing an account for sale is the other side of the same decision.
Questions about the research engine
These are the questions we are asked most often about how the hypothesis engine works, what the 2026-08-19 run proves, and how much weight a provisional finding should carry. Every answer below comes from the same run recorded in our own research tables.
Does zero promoted findings mean nothing affects growth?
No. Promotion requires three consecutive passing runs and only one run has completed, on 2026-08-19, so zero is forced by the rule rather than found in the data. 344 hypotheses cleared every statistical gate on that run and are held as provisional. The correct reading is that nothing has yet been confirmed by repetition, not that nothing works.
What does refuted mean here?
It means the entire 95 percent interval sits inside plus or minus 10 percent, so the claim is bounded below the smallest effect worth changing behaviour over. Across the 681 refuted findings the median absolute effect is 1.95 percent and the median interval is 8.67 points wide. That is a positive result about absence, not a failure to measure.
How large was the sample behind each test?
The run pooled 201,968 original posts from 3,294 accounts over the 90 days ending 2026-08-19. Each individual test needed at least 500 posts and 50 distinct accounts to run at all, and 464 of the 3,492 tests were rejected for missing one of those floors. The median test used 2,195 posts across 204 accounts.
Do these numbers apply to a small account?
Not directly. Every account in the run had at least 1,644,259 followers, because the scan backfill takes the largest unscanned accounts first. The direction of the composition findings is plausible more broadly, but the magnitudes were measured on very large accounts and should not be quoted for a small one without that caveat attached.
Is posting time genuinely irrelevant?
Timing hypotheses passed at 2.3 percent (41 of 1,780) and produced zero survivors in 445 tests against engagement per impression. Day of week and weekend did survive on reach, at plus 18.7 percent engagement for weekend posting across 47,138 posts. So timing moves distribution by roughly 10 to 20 percent at most, and does not measurably change how the reached audience responds.
Why does the engine record its failures at all?
Because a rejection reason is data. Knowing that 1,813 tests died at false-discovery correction, 546 at the effect-size floor and 464 at the sample floors tells you where the evidence is thin and where it is genuinely flat. A system that stored only its wins would give no way to tell a bounded non-effect from a question nobody could answer.
Can this be reproduced?
The gates are fixed in code as constants: 50 accounts, 500 posts, alpha 0.05 for Benjamini-Hochberg, a 10 percent minimum effect applied to the interval bound nearest zero, an uncorrected 5 percent on the weaker split half, and three consecutive runs for promotion. Every test row keeps its effect, both interval bounds, p, q, the sample sizes and the gate that stopped it.
Related Articles
Continue learning with these related guides.
Does Twitch Account Age Still Matter? We Measured 432,192
Across 432,192 Twitch channels read on 2026-09-08, account age is almost pure accumulation, and at a matched follower count the newer channel wins.
X Bookmark Rate Benchmarks From 94,318 Scored Accounts
Half the X accounts we scored on ten or more posts bookmark under 0.0273% of their views, and a third of original posts get no bookmarks at all.