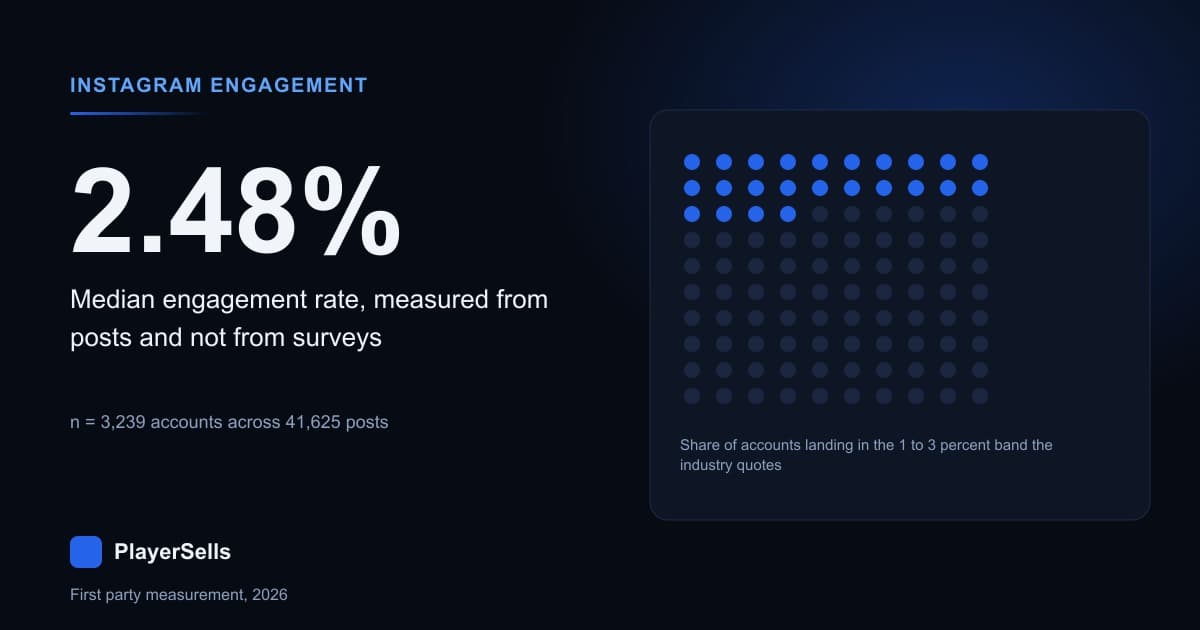
The median Instagram account we can measure runs a 2.48 percent engagement rate in 2026, computed as mean likes plus comments per post divided by follower count, across 3,239 accounts and 41,625 posts we crawled between 2026-08-29 and 2026-09-02. That is the direct answer, and it comes from post objects we fetched ourselves rather than from a vendor survey of client accounts. The result underneath it is more useful: only 767 of those 3,239 accounts, 23.7 percent, land inside the 1 to 3 percent band the industry quotes as normal.
The rest fall outside in both directions. We measured 1,003 accounts, 31.0 percent of the sample, below 1 percent, and 1,469 accounts, 45.4 percent, above 3 percent. A range that covers under a quarter of a real sample is not a benchmark. What follows is the full ladder by follower band, the size effect behind it, and one measurement showing that the size effect is mostly arithmetic rather than audience quality.
What our Instagram sample is, and what it is not
Our Instagram directory holds 13,486 account rows and 173,194 posts, with post timestamps running from 2011-06-27 to 2026-09-02. Follower count is populated on only 3,308 of those 13,486 rows, or 24.5 percent, because the remaining rows were discovered through the post graph and never received a full profile fetch. Those uncovered rows carry no biography, no media count and no category either: zero of 10,178. The 3,308 covered rows are the entire basis for every engagement rate in this article.
That covered subset is not a random slice of Instagram. Its median account has 1,020,514 followers, with a quartile range of 232,042 to 4,357,377 and a maximum of 686,336,276. We measured 81.8 percent of it as verified and 95.0 percent as business accounts. This is a directory of notable accounts, which is a different bias from the one vendor benchmarks carry: agency reports sample their own client roster, which skews small and commercial. Ours skews large and public. Say which bias you are reading.
The direction of our bias is measurable. Among the 3,308 covered accounts the median precomputed average like count is 23,565; among the 10,178 uncovered rows it is 11,650. Covered accounts are 2.02 times larger in absolute engagement. Since engagement rate falls with size in every cut we ran, the true median across the whole directory is probably above 2.48 percent, not below it. The number we publish is the conservative one. Our crawler stores 12 posts per account at the median, spanning 136 days for the median account, from 2026-03-27 to 2026-08-27.
How does engagement rate change with follower count?
Sharply, and monotonically. Splitting the 3,239 analysed accounts into decade bands gives an eighty-fold spread from the smallest band to the largest. The table below reports the distribution of per-account engagement rate, expressed as a percentage of follower count, inside each band, along with the median precomputed like and comment counts our crawler recorded for those accounts.
| Follower band | Accounts | Median followers | ER P25 | Median ER | ER P75 | Median avg likes | Median avg comments |
|---|---|---|---|---|---|---|---|
| Under 10K | 98 | 5,175 | 5.44% | 30.39% | 137.96% | 1,088 | 17 |
| 10K to 100K | 436 | 47,480 | 1.27% | 5.69% | 17.81% | 1,909 | 33 |
| 100K to 1M | 1,085 | 398,760 | 1.22% | 3.73% | 9.66% | 14,271 | 135 |
| 1M to 10M | 1,214 | 3,060,152 | 0.52% | 1.79% | 4.75% | 49,415 | 471 |
| 10M to 100M | 377 | 18,396,124 | 0.26% | 1.00% | 2.49% | 181,081 | 1,345 |
| Over 100M | 29 | 209,495,650 | 0.18% | 0.38% | 0.71% | 497,605 | 4,421 |
Read the under-10K row with suspicion. It holds 98 accounts, 28 of which score above 100 percent, which is arithmetically impossible as a share of followers and tells you the denominator has stopped meaning what the formula assumes. A sub-10K account is in a directory seeded from notable accounts because something about it surfaced, so that band is a selection of small accounts that travelled, not a sample of small accounts. We publish it with its n and we do not build a headline on it.
Comment behaviour moves with size too. Comments run at 1.55 percent of likes in the under-10K band and 0.75 percent in the over-100M band, so the largest accounts collect roughly half as many comments per like as the smallest. If you are checking an account before purchase, that ratio is one of the cheapest tells available, and it is the kind of thing worth running through a follower authenticity audit before money moves.
Is the size effect real, or an artifact of the bucketing?
We re-ran it with a completely different bucketing. Instead of decade bands with wildly unequal sample sizes, we split the same 3,239 accounts into five equal quintiles by follower count, 647 to 648 accounts each. The gradient survives, at a gentler 6.6 times rather than 80 times, which tells you the decade version was being stretched by its two tiny end bands.
| Quintile | Accounts | Follower range | Median engagement rate | Accounts with Reels | Median engagement per 100 Reel views |
|---|---|---|---|---|---|
| Q1 | 648 | 133 to 156,861 | 6.51% | 528 | 11.76 |
| Q2 | 648 | 157,976 to 605,957 | 4.02% | 528 | 13.54 |
| Q3 | 648 | 607,291 to 1,785,037 | 2.58% | 539 | 12.66 |
| Q4 | 648 | 1,786,817 to 5,821,370 | 1.85% | 556 | 12.84 |
| Q5 | 647 | 5,823,266 to 686,336,276 | 0.99% | 577 | 13.84 |
The middle quintile's median of 2.58 percent sits close to the whole-sample median of 2.48 percent, which is the consistency check we wanted. But look at the last column. Engagement rate falls 6.6 times from Q1 to Q5 while engagement per 100 Reel views rises slightly, from 11.76 to 13.84. Two metrics on the same 3,239 accounts, one collapsing and one flat. That gap is the whole finding.
Why does engagement per view stay flat while engagement rate collapses?
Because followers stopped being the denominator that matters. Instagram distributes Reels well past the follower graph, so a post's audience is no longer bounded by the account's follower count. We measured reach as view count over follower count on 15,206 Reel posts from accounts where both numbers are known, and the ratio falls almost exactly as fast as engagement rate does.
| Follower band | Accounts with Reels | Median views per follower | Reels reaching more people than followers | Median engagement per 100 views |
|---|---|---|---|---|
| Under 10K | 82 | 0.72 | 49.9% | 10.33 |
| 10K to 100K | 355 | 0.13 | 20.3% | 12.43 |
| 100K to 1M | 895 | 0.10 | 12.8% | 12.81 |
| 1M to 10M | 1,033 | 0.05 | 4.3% | 13.08 |
| 10M to 100M | 336 | 0.02 | 1.3% | 13.64 |
| Over 100M | 27 | 0.01 | 0.0% | 18.13 |
Median reach per follower drops 77 times across those bands, from 0.72 to 0.0093, while median engagement rate drops 80 times across the identical bands. Engagement per view moves 1.8 times, and it moves upward. The people who see a large account's Reel like and comment on it at least as readily as the people who see a small account's Reel. What changed is the fraction of the follower list a post reaches, not the enthusiasm of the audience.
This is association measured across one cross-section, not a causal experiment, and we say so plainly. But the arithmetic is hard to argue with: if reach per follower falls 77 times and engagement per unit of reach is flat, then engagement per follower must fall about 77 times whatever else is true. Half of all Reels from sub-10K accounts in our crawl reached more people than the account has followers. Zero of the 145 Reels we hold from accounts above 100M followers did.
One caveat on the metric: view count is Instagram's own play counter as returned in the profile media response, and we do not redefine it. It exists on 65,742 of 65,747 Reels and 113 of 114 IGTV posts in our crawl, and on none of the 63,140 carousels and effectively none of the 27,096 feed photos. Views are a Reels-only measurement on Instagram, which is why the flat-engagement-per-view result can only be tested on video.
Is the standard engagement rate formula overstating your typical post?
Yes, by about a factor of two. The industry formula averages likes and comments across recent posts and divides by followers. Averages are wrecked by outliers, and Instagram engagement is extremely heavy-tailed: within the same account, the best post in our crawl collects 4.4 to 13.5 times the engagement of that account's median post, depending on band.
Pooling all 41,625 posts and computing each post's own engagement as a share of its account's followers, the median post scores 1.20 percent, with a quartile range of 0.25 to 4.70 percent. The account-level average formula on the same data returns 2.48 percent. So the standard number reads 2.07 times higher than what a typical post on a typical account actually earns. Both figures are correct for their question, but only one of them describes what happens when you post next Tuesday.
The mean is worse still. The arithmetic mean engagement rate across the 3,239 accounts is 22.25 percent, and the 99th percentile is 217.90 percent. Sixty-two accounts, 1.9 percent of the sample, score above 100 percent. Those 62 have a median of 14,054 followers and half their posts are Reels, which is the same reach mechanism seen from the other end. Anyone quoting an average Instagram engagement rate rather than a median is quoting a number no account is near.
Which categories beat their size band?
Comparing categories head to head is confounded, because the median follower count of a category in our data ranges from about 100,000 to 3.7 million. To control for that we restricted the comparison to a single band, the 1M to 10M accounts, where the median account of every listed category sits between 1.8M and 3.4M followers. The band's own median engagement rate is 1.79 percent, so read each row against that.
| Instagram category | Accounts | Median followers | Median engagement rate | Versus band median |
|---|---|---|---|---|
| Athlete | 69 | 2,709,895 | 5.56% | 3.1x |
| Actor | 56 | 2,782,255 | 2.50% | 1.4x |
| Artist | 70 | 3,416,207 | 2.20% | 1.2x |
| Digital creator | 20 | 1,837,558 | 1.67% | 0.9x |
| Creators and Celebrities | 23 | 3,555,468 | 1.26% | 0.7x |
| Public figure | 27 | 2,865,821 | 1.21% | 0.7x |
| General merchandise stores | 37 | 2,201,974 | 0.17% | 0.1x |
| Publishers | 34 | 3,309,752 | 0.17% | 0.1x |
Athletes at 5.56 percent and publishers at 0.17 percent differ 32.7 times at almost identical follower size, 2.71M against 3.31M. Category self-labelling is voluntary and populated on only 1,432 of our 3,308 covered rows, so treat these as descriptive of the accounts that declared a category. The practical read for anyone browsing the Instagram accounts directory is that a follower count means something different in a merchandise niche than it does in sport.
Does a cached engagement rate agree with the posts behind it?
Sometimes. Each account row in our directory carries a precomputed engagement rate alongside average likes, average comments and a posts-analysed count. The brief for this article asked us to recompute engagement independently from the post table and report whether the two agree. They do, conditionally, and the condition is the interesting part.
| Row state | Accounts | Share of sample | Agree within 0.01 points | Median absolute gap | P90 absolute gap |
|---|---|---|---|---|---|
| Cached post count matches stored posts | 2,628 | 81.1% | 97.4% | 0.0000 pts | 0.0011 pts |
| Cached post count differs | 611 | 18.9% | 8.2% | 0.3064 pts | 11.7344 pts |
Where the cached posts-analysed count equals the number of post rows we actually hold, the stored engagement rate reproduces our independent recomputation for 97.4 percent of 2,628 accounts, with a median absolute gap of zero. Where the counts disagree, only 8.2 percent of 611 accounts match, the median gap is 0.31 percentage points, and one account in ten is off by more than 11.73 points. The stored value is not wrong, it is stale: it was computed against a post set that has since changed.
That is a general lesson about any engagement figure a seller shows you. It was computed at some moment, against some post set, and neither is usually disclosed. When we take a listing at our account marketplace we would rather recompute from posts than trust a screenshot, and any buyer should apply the same rule. Our Instagram engagement rate calculator runs the recomputation on a live handle so you can compare it against whatever the seller claimed.
How much does the measurement window change the answer?
Enough to explain most published disagreements between one benchmark report and another. Holding our sample and our formula constant and changing only which posts are allowed to count, the median engagement rate moves 47 percent, from 2.48 percent down to 1.69 percent. That single choice swings the answer further than the gap between most competing industry figures.
| Post window | Accounts | Posts | Median engagement rate |
|---|---|---|---|
| All posts we hold | 3,239 | 41,625 | 2.48% |
| Posts from the last 365 days | 3,201 | 38,017 | 2.09% |
| Posts from the last 90 days | 3,062 | 29,950 | 1.69% |
We deliberately do not present that as evidence that Instagram engagement is falling. Our Instagram crawler is five days old, we hold no follower time series, and three explanations fit equally well: engagement genuinely declining, accounts growing so recent posts divide into a larger follower base, or the post set changing composition as short-window filters drop low-cadence accounts. Separating those needs a follower history we do not yet have. We report the sensitivity so nobody quotes one of our windows as though the others do not exist.
We headline the all-posts figure because our crawler stores 12 posts per account at the median, which is the same depth most published engagement rate tools use, making 2.48 percent the number directly comparable to theirs. If you want the conservative recent-quarter figure instead, 1.69 percent across 3,062 accounts is it.
What a buyer or seller should take from this
Price the reach, not the ratio. An account with 3 million followers and a 1.8 percent engagement rate is not underperforming an account with 40,000 followers and a 5.7 percent rate. The two are in different reach regimes, and per unit of actual reach they perform within about 1.05 times of each other in our data. If a seller quotes engagement rate as evidence of audience quality, ask what fraction of their followers the last ten posts reached.
Three checks are worth running before you send money. Recompute engagement from the current posts rather than the profile screenshot, because 18.9 percent of the cached figures in our own directory drift from their post sets. Compare against the correct band, since the 2.48 percent all-sample median is meaningless for a 20 million follower account whose band median is 1.00 percent. And treat any figure above roughly 20 percent as a reach story rather than a loyalty story, because 90 percent of accounts we measured sit below 20.02 percent.
Anyone weighing an Instagram purchase should read our guide on checking whether an account has real followers before you buy, which uses X data but applies the same audit logic. The regulatory floor matters too: our explainer on the FTC fake follower rule sets out what is actually banned when engagement is inflated on purpose. When you are ready to act, browse Instagram accounts for sale or list your own account, and put the figures through our Instagram earnings estimator before you agree a price.
One honesty note on our own marketplace. We hold exactly three Instagram listings and zero completed Instagram sales as of 2026-09-02, so we will not publish an Instagram price benchmark from our own transactions. The engagement measurements in this article come from our directory crawl, which is large. Our Instagram sales history is not, and pretending otherwise would be the same error we are criticising elsewhere.
Common questions about Instagram engagement rate
These are the questions buyers and sellers ask us most often about the numbers above. Every answer below is drawn from the same first-party sample: 3,239 Instagram accounts and 41,625 posts we crawled between 2026-08-29 and 2026-09-02, with follower counts read from the profile object at fetch time. Where a figure applies only to a follower band or a post type, we say which one.
What is a good Instagram engagement rate in 2026?
It depends entirely on size. Against our sample of 3,239 accounts, the median is 2.48 percent overall, but 3.73 percent for 100K to 1M accounts, 1.79 percent for 1M to 10M, and 1.00 percent for 10M to 100M. Compare against your own band, not the global figure. Being at your band's 75th percentile is a far more meaningful claim than clearing 3 percent.
Is 1 percent engagement bad on Instagram?
Not necessarily. We measured 1,003 of 3,239 accounts, 31.0 percent, below 1 percent, and most of them are large. In the 10M to 100M band the median is 1.00 percent exactly, so a 1 percent rate is precisely average there. In the 100K to 1M band the same 1 percent would sit below the 25th percentile of 1.22 percent. The number needs a size attached before it means anything.
Why do Reels get more views than an account has followers?
Because Instagram serves Reels to non-followers. In our crawl 49.9 percent of Reels from accounts under 10K followers recorded more views than the account has followers, falling to 20.3 percent for 10K to 100K accounts and 0.0 percent above 100M. That is why engagement rate expressed as a share of followers can exceed 100 percent, as it does for 62 accounts, 1.9 percent of our sample.
How do you calculate Instagram engagement rate correctly?
Sum likes and comments per post, average across a stated number of recent posts, divide by current follower count, and publish the post count and window alongside the result. Skipping that disclosure is why published benchmarks disagree: on our own data, changing only the window moved the median from 2.48 percent to 1.69 percent. Report the median across accounts rather than the mean, which our sample puts at 22.25 percent.
Do verified accounts have higher engagement?
Lower, in our data, but the comparison is not clean. Verified accounts in the sample number 2,643 with a median engagement rate of 2.21 percent, against 5.03 percent for 596 unverified accounts. Verified accounts also carry a median 1,586,976 followers against 96,239, a 16.5 times size difference. That size gap explains the engagement gap, so this is not evidence that verification suppresses engagement.
Can I trust the engagement rate a seller shows me?
Only if it was recomputed from current posts. In our own directory, 611 of 3,239 account rows, 18.9 percent, carry a cached engagement rate that disagrees with a recomputation from the posts we hold, with a 90th percentile gap of 11.73 percentage points. A seller screenshot has the same failure mode and no timestamp. Recompute it, or have the marketplace recompute it, before agreeing a price.
Which Instagram niches have the highest engagement?
Within the 1M to 10M follower band, where account sizes are comparable, athletes led at a 5.56 percent median across 69 accounts and publishers trailed at 0.17 percent across 34, a 32.7 times spread at nearly identical follower counts. Category labels are self-declared and present on only 1,432 of our 3,308 profiled accounts, so read the ranking as descriptive of accounts that declared a category.
Related Articles
Continue learning with these related guides.
Does Twitch Account Age Still Matter? We Measured 432,192
Across 432,192 Twitch channels read on 2026-09-08, account age is almost pure accumulation, and at a matched follower count the newer channel wins.
X Bookmark Rate Benchmarks From 94,318 Scored Accounts
Half the X accounts we scored on ten or more posts bookmark under 0.0273% of their views, and a third of original posts get no bookmarks at all.