Do carousels really beat Reels on Instagram?
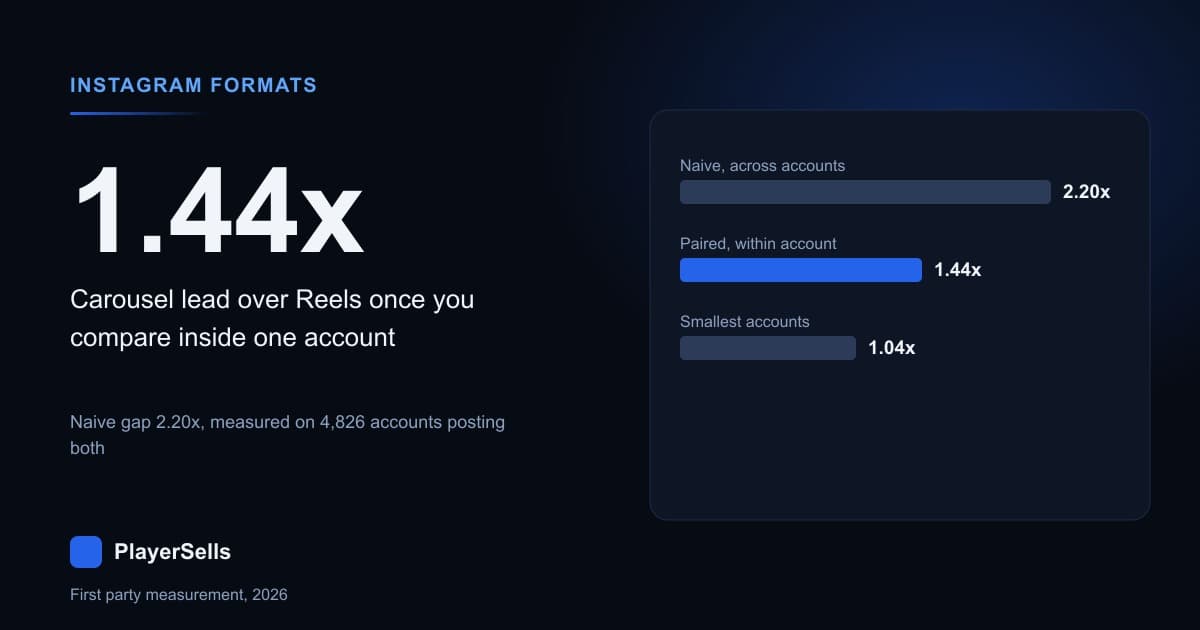
Across 173,198 Instagram posts we crawled ourselves, 87.7 percent of them published in 2026, the median carousel collected 8,922 likes and the median Reel collected 4,063. That 2.2x gap is where the format argument usually stops. Most of it is not about format. Comparing carousels against Reels inside the same account, the only comparison that holds the audience constant, cuts the advantage to 1.44x across the 4,826 accounts that publish both. Among the smallest accounts in the sample the advantage disappears: their median carousel and their median Reel both landed on 96 likes.
The cause is a selection effect, not an algorithm story. Accounts that post carousels are bigger. Weighted by post, the median account behind a carousel in our file has a baseline of 7,148 likes per post, against 4,295 for the account behind a Reel and 2,167 behind a single photo. A raw format median is therefore partly a comparison of audiences. What follows reports the naive result and the within-account result side by side, so you can see exactly how much of the headline survives being controlled.
The raw split, and the sample behind it
Our Instagram directory held 173,198 posts from 13,417 accounts when these queries ran on 2026-09-02, with timestamps from 2011-06-27 to 2026-09-02. The crawl is weighted heavily toward the present: 151,867 posts, 87.7 percent of the file, were published in 2026. Instagram tags each post with a product type, and four tags carry enough volume to analyse. The table below gives the like distribution for each one, unadjusted, exactly as a naive comparison would read it.
| Format (product_type) | Posts | P25 likes | Median likes | P75 likes | P90 likes | Median comments |
|---|---|---|---|---|---|---|
| Carousel | 63,137 | 777 | 8,922 | 54,813 | 223,215 | 94 |
| Reel (clips) | 65,745 | 540 | 4,063 | 23,769 | 102,029 | 68 |
| Single photo (feed) | 27,086 | 164 | 1,958 | 14,475 | 76,403 | 33 |
| Unlabelled | 17,112 | 2,427 | 16,063 | 88,262 | 347,657 | 128 |
That unlabelled row is the first thing to throw out, and it is worth explaining why. Those 17,112 posts come from 2,280 accounts, 1,930 of which also produced normally labelled posts, and not one of them carries a video flag or a view count. The pattern is a response shape from our own collector rather than an Instagram format, and the accounts behind it are large, with a median baseline of 11,091 likes per post. Reading its 16,063 median as evidence that a fourth format outperforms would be reading our crawler, so it is excluded from every comparison below.
Why does the carousel lead shrink inside a single account?
A cross-format median compares posts, and posts are not randomly assigned to accounts. To strip that out, we computed each account's median like count separately for carousels and for Reels, then compared the two figures within the account. Only accounts publishing at least three of each format qualify. On that test, measured across 4,826 accounts, carousels beat Reels in 3,053 accounts, lost in 1,520, and tied in 253. The median within-account ratio is 1.435.
Raising the bar does not change the answer. The table reports the paired result at four minimum-post thresholds, and the median ratio sits between 1.41 and 1.60 at all of them. Direction is not in question: a sign test across the 4,573 accounts that did not tie returns z = 22.7. Magnitude is what moved, from 2.2x down to roughly 1.4x.
| Minimum posts of each format | Accounts compared | Carousel higher | Reel higher | Ties | Median within-account ratio |
|---|---|---|---|---|---|
| 1 of each | 8,565 | 5,306 | 2,847 | 412 | 1.407 |
| 3 of each | 4,826 | 3,053 | 1,520 | 253 | 1.435 |
| 5 of each | 1,763 | 1,130 | 556 | 77 | 1.428 |
| 10 of each | 108 | 64 | 43 | 1 | 1.596 |
Stated as a share, about 64 percent of the published carousel advantage is account selection and roughly a third of it is format. Anyone quoting 2.2x as guidance for their own grid is quoting a number that mostly describes which accounts choose to post carousels, measured across our crawl of 173,198 posts.
Could our crawler have produced this result?
Three artifacts could manufacture a within-account carousel advantage, and each was tested before publication. Carousels in our file are older on median than Reels, 2026-07-29 against 2026-08-15, because the collector captures a fixed depth of recent posts and Reels are published more frequently, so the Reels we see span a shorter stretch of calendar. If likes accumulate with age, that alone would flatter carousels.
Restricting both formats to the same 90 day window returned 1.428 across 3,523 accounts, which is the same answer. Restricting further to posts published between 2026-03-01 and 2026-08-03, so every post had at least 30 days to mature before we read it, returned 1.515 across 883 accounts, with the two formats' median timestamps half a day apart. Swapping the summary statistic instead of the window moves the figure but never the sign.
| Specification | Units compared | Carousel win rate | Ratio |
|---|---|---|---|
| Naive, post level, no pairing | 128,882 posts | not applicable | 2.196 |
| Paired, all posts, 3+ of each | 4,826 accounts | 63.3% | 1.435 |
| Paired, last 90 days only | 3,523 accounts | 63.6% | 1.428 |
| Paired, posts matured 30+ days | 883 accounts | 63.8% | 1.515 |
| Paired, geometric mean per account | 4,826 accounts | 62.9% | 1.415 |
| Paired, arithmetic mean per account | 4,826 accounts | not applicable | 1.242 |
Every specification lands between 1.24x and 1.52x, and none approaches 2.2x. A result that survives a window change, a maturity filter and three different summary statistics is not a sampling artifact, so the paired finding stands. The naive figure does not.
Does account size change the answer?
Yes, and this matters more than the headline does. Splitting the same paired accounts by size turns one average into a gradient. We banded accounts by their median comment count rather than by likes, because likes sit on both sides of the ratio and banding on them would build in regression to the mean. Comments measure the same audience independently.
Among the 463 smallest accounts, carousels won 236 pairs and Reels won 185, and the median within-account ratio is 1.044. Their median carousel and their median Reel both sit at 96 likes. At the other end, among the 637 largest accounts, carousels won 460 pairs against 170 and the median ratio is 1.618. The advice to favour carousels is derived from accounts at the top of this table, and it does not transfer to the bottom of it.
| Account size (median comments per post) | Accounts | Carousel higher | Reel higher | Median carousel likes | Median Reel likes | Median ratio |
|---|---|---|---|---|---|---|
| Under 5 | 463 | 236 | 185 | 96 | 96 | 1.044 |
| 5 to 20 | 686 | 394 | 228 | 640 | 449 | 1.243 |
| 20 to 100 | 1,588 | 1,020 | 476 | 4,306 | 2,501 | 1.468 |
| 100 to 500 | 1,452 | 943 | 461 | 21,904 | 13,916 | 1.504 |
| 500 or more | 637 | 460 | 170 | 144,735 | 83,742 | 1.618 |
The gradient is monotonic across all five bands. Banding by median likes instead of comments produces the same shape and a slightly steeper version of it, with the smallest band at a median ratio of exactly 1.000 and carousels winning only 40.8 percent of those 901 pairs. A sign test on the smallest comment band gives z = 2.5, a real but negligible edge worth about 4 percent. The largest band gives z = 11.6.
Why do larger accounts get more out of carousels?
Part of the reason is what they publish. Format mix shifts steadily with audience size in our own crawl, and the largest band posts carousels more often than any other format while the smallest band is close to an even three way split. That mix difference is also the mechanism behind the naive 2.2x, because post level medians are dominated by whoever posts the most.
| Account size (median comments per post) | Accounts | Share carousels | Share Reels | Share single photos |
|---|---|---|---|---|
| Under 5 | 1,401 | 33.3% | 34.9% | 31.8% |
| 5 to 20 | 1,713 | 36.7% | 40.7% | 22.6% |
| 20 to 100 | 3,447 | 40.7% | 43.0% | 16.3% |
| 100 to 500 | 3,074 | 45.1% | 40.8% | 14.2% |
| 500 or more | 1,572 | 54.3% | 33.2% | 12.5% |
Of the 13,417 accounts in the file, 10,119 published at least one carousel, 11,378 published at least one Reel, 7,218 published at least one single photo, and 5,532 published all three. Reels are the most widely adopted format counted by accounts. Carousels are the most heavily used format among the largest accounts, which is a different statement, and it is the one that ends up inside the raw median. Anyone benchmarking a grid against the wider population can browse the Instagram account directory these measurements are drawn from.
What is a Reel actually buying you?
View count exists only on video posts in Instagram's response, so likes are the sole metric that compares across all three formats and no view based cross-format claim is possible here. The video only column still repays reading on its own terms. Across the 65,740 Reels carrying a view count, the median Reel drew 109,302 views, with a P25 of 20,373 and a P90 of 1,814,315, and converted a median 4.15 percent of those views into a like.
Scaling views against each account's own like baseline shows what Reels do for small accounts. A Reel from an account whose typical post gets under 500 likes pulls a median 7,217 views, which is 68.3 times that account's baseline. For an account whose typical post gets over 50,000 likes, a Reel pulls 1,376,526 views, only 10.5 times its baseline. Reels reach past the follower list, and the smaller that list is, the larger the effect is relative to everything else the account does.
| Account baseline (median likes per post) | Reels measured | Median Reel views | Views per baseline like | Likes as share of views |
|---|---|---|---|---|
| Under 500 | 13,859 | 7,217 | 68.3x | 2.21% |
| 500 to 2,000 | 10,575 | 30,043 | 28.0x | 3.72% |
| 2,000 to 10,000 | 17,441 | 105,589 | 22.8x | 4.16% |
| 10,000 to 50,000 | 14,836 | 364,612 | 17.6x | 4.93% |
| Over 50,000 | 8,372 | 1,376,526 | 10.5x | 6.77% |
Like rate moves the opposite way, from 2.21 percent for the smallest accounts to 6.77 percent for the largest. A large account's Reel is mostly served to people already following it, and warm viewers like. A small account's Reel is mostly served to strangers, and strangers scroll. That reading is associated with the pattern rather than proven by it, since we observe distribution outcomes and never Instagram's routing decisions.
Which format is riskier to post?
A median hides the shape of a distribution, and shape is where these two formats genuinely differ. Measured against each account's own median, across accounts with at least 10 posts, 7.39 percent of Reels reached ten times their account baseline against 4.92 percent of carousels. Reels are half again as likely to break out of their own account's normal range.
Reels are also far more likely to fail. 26.71 percent of Reels landed at or below half their account baseline, against 14.25 percent of carousels and 24.14 percent of single photos. A Reel is a lottery ticket with a wider payoff and a much wider loss. A carousel is a floor. For an account being valued on what it delivers every week rather than on occasional spikes, that difference outweighs the median.
| Format | Posts measured | Share at 3x baseline or more | Share at 10x baseline or more | Share at half baseline or less | P90 relative to baseline |
|---|---|---|---|---|---|
| Reel | 58,813 | 17.03% | 7.39% | 26.71% | 6.33x |
| Carousel | 62,418 | 14.32% | 4.92% | 14.25% | 4.35x |
| Single photo | 26,777 | 13.72% | 5.24% | 24.14% | 4.30x |
At the extreme top the formats converge. The 99th percentile relative post is 632.8x baseline for Reels and 627.4x for carousels, so the very biggest breakout is not a video phenomenon. The difference lives in the middle of the distribution, where most posts and most valuations actually sit.
Are single photos finished, and what happens to comments?
A single image is the format every guide declares dead. Paired inside the account, it is not dead relative to video. Across 2,239 accounts that published at least three Reels and three single photos, the median ratio of Reel likes to photo likes is 0.997, and Reels won only 46.2 percent of those pairs. On like count, held within the same account, a Reel and a plain photo are indistinguishable.
| Paired comparison | Accounts | First format wins | Median within-account ratio |
|---|---|---|---|
| Carousel against Reel | 4,826 | 63.3% | 1.435 |
| Carousel against single photo | 2,451 | 61.1% | 1.284 |
| Reel against single photo | 2,239 | 46.2% | 0.997 |
Comments reverse the ranking. Per 1,000 likes, Reels drew a median 15.5 comments, single photos 12.8 and carousels 9.6, measured across 155,887 posts carrying a positive like count. Reels earn relatively more conversation per unit of approval, which is the one cross-format metric where video clearly leads. Pick comments as the success metric instead of likes and the industry claim comes back intact, a fair reminder that format advice is only as stable as the metric underneath it.
What we could not measure
Four limits are worth stating plainly rather than burying. View count is present only on video posts, so no view based comparison across formats exists in this data and none was attempted. Follower counts are populated on a small minority of rows in our Instagram account table, so every size band above is built from an account's own like or comment baseline instead of its follower count, which is a deliberate substitution and not an oversight.
Content selection inside an account cannot be observed at all. If creators reserve their strongest material for carousels, some of the surviving 1.4x is subject matter rather than format, and no amount of post level data separates the two. The file is also a crawl and not a census: 13,417 accounts our collectors reached, weighted toward the last twelve months, and not a random sample of Instagram. Audience decline is a separate question, covered in our measurement of what six million daily snapshots show about shrinking accounts.
How should you read format data before buying an account?
A seller showing a carousel heavy grid with steady like counts is showing something that reproduces. A seller showing two viral Reels is showing the 7.39 percent tail. Ask for the median rather than the best week, and ask for it separately per format, because a grid that only performs on Reels has 26.71 percent of its posts landing under half its own baseline and will look very different in a quiet month.
The practical checks are the ones we run before an account goes live. Push the grid through our Instagram engagement rate calculator to get a per post baseline instead of a follower ratio, then price the audience with the Instagram earnings estimator before arguing about an asking figure. Verify the audience itself using the method in our guide to checking whether an account's followers are real, because a format median computed over inflated followers tells you nothing.
Format mix is a due diligence signal in both directions. A carousel heavy account is more predictable and easier to underwrite. A Reel heavy account may be carrying reach it never converted into followers, which the 68.3x view multiple for small accounts makes very easy to do. Sellers should attach per format medians when they list an account for sale. Buyers can compare live asking prices across the current marketplace listings or start directly with Instagram accounts for sale.
Common questions about carousel and Reel engagement
These are the questions we are asked most often about Instagram format performance, answered from the same sample of 173,198 posts across 13,417 accounts rather than from vendor benchmarks or agency case studies. Every figure below comes from a query we ran against our own directory on 2026-09-02, and each one carries the sample it was measured on.
Do carousels get more engagement than Reels?
On likes, yes, but by far less than the raw numbers suggest. Across 173,198 posts the median carousel got 8,922 likes and the median Reel 4,063, a 2.2x gap. Compared within the same account across 4,826 accounts that post both, the gap falls to 1.44x. On comments per 1,000 likes the ranking flips: Reels lead at 15.5 against 9.6 for carousels.
Why is the 2.2x carousel advantage misleading?
Because it compares different accounts, not different formats. Weighted by post, the median account behind a carousel in our crawl has a baseline of 7,148 likes per post against 4,295 for the account behind a Reel, and the largest accounts publish 54.3 percent carousels against 33.3 percent for the smallest. About 64 percent of the raw gap is that composition difference rather than format.
Should a small Instagram account post carousels or Reels?
For the 463 smallest accounts we paired, format made almost no difference to likes: their median carousel and their median Reel both returned 96 likes, a within-account ratio of 1.044. Reels did deliver reach those accounts could not get otherwise, at a median 7,217 views or 68.3 times their own like baseline. The real choice is reach against consistency, not engagement.
How many views does an average Instagram Reel get?
Across 65,740 Reels carrying a view count in our directory, the median drew 109,302 views, with a P25 of 20,373 and a P90 of 1,814,315. That median is not a typical creator's experience, because large accounts pull it upward. Reels from accounts whose typical post gets under 500 likes drew a median 7,217 views instead, which is the more useful number for most people.
Are single image Instagram posts still worth publishing?
Measured inside the account, a single photo performs the same as a Reel on likes. Across 2,239 accounts publishing at least three of each, the median Reel to photo ratio is 0.997 and Reels won only 46.2 percent of the pairs. Carousels beat single photos at 1.284x across 2,451 accounts, so the honest ranking is carousels first, with photos and Reels level behind them.
Can carousels and Reels be compared on views?
No. Instagram returns a view count only for video product types, so in our file 65,740 of 65,745 Reels carry views while carousels carry none at all. Any published comparison of carousel views against Reel views is either estimating one side or drawing on a different data source. Likes and comments are the only two metrics available on both formats.
Does format mix change what an Instagram account is worth?
It changes how predictable the account is, which is what a buyer underwrites. Reels put 26.71 percent of posts below half the account baseline against 14.25 percent for carousels, while offering a 7.39 percent chance of a 10x post against 4.92 percent. A Reel heavy account is a wider distribution at the same median, and that spread belongs in the price.
Related Articles
Continue learning with these related guides.
Does Twitch Account Age Still Matter? We Measured 432,192
Across 432,192 Twitch channels read on 2026-09-08, account age is almost pure accumulation, and at a matched follower count the newer channel wins.
X Bookmark Rate Benchmarks From 94,318 Scored Accounts
Half the X accounts we scored on ten or more posts bookmark under 0.0273% of their views, and a third of original posts get no bookmarks at all.