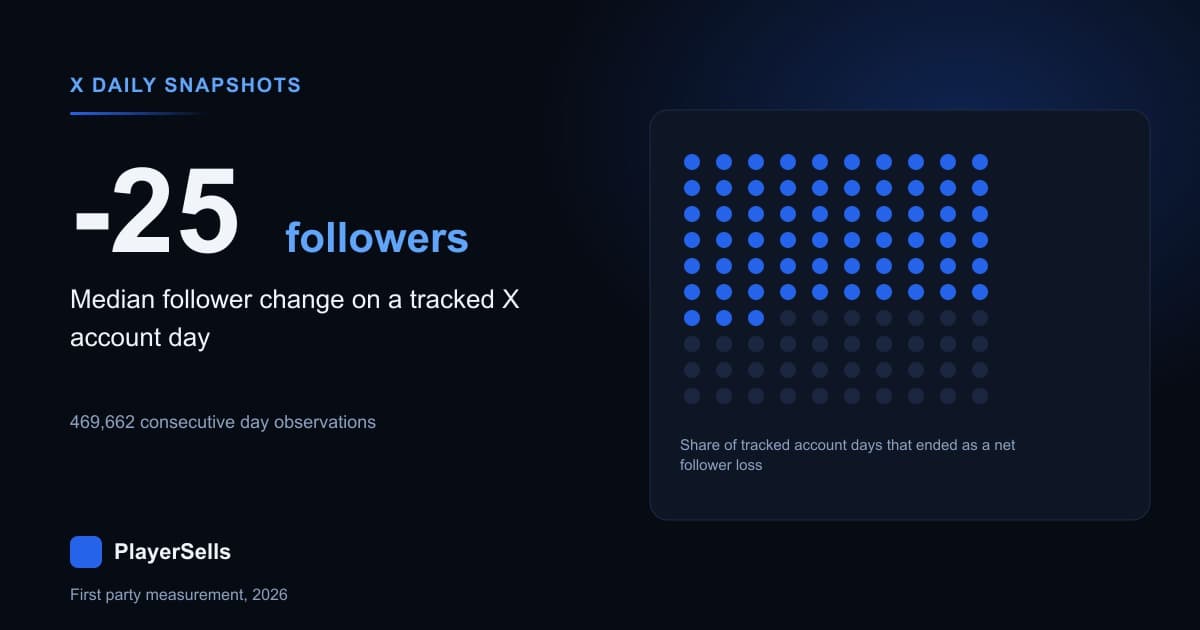
Across 548,004 daily follower snapshots of 48,967 X (formerly Twitter) accounts, captured by our own crawler between 2026-06-09 and 2026-09-02, the median tracked day was a loss of 25 followers rather than a gain. Restricted to the 469,662 observations where two consecutive calendar days were genuinely captured, 63.2 percent were net follower losses, 36.3 percent were gains, and 0.5 percent were exactly flat. The mean daily change across those same rows was positive 735.4 followers. That mean is the number most growth advice is implicitly built on, and a heavy right tail produces it.
The gap between those two numbers is the finding. In the balanced panel of 6,236 accounts we captured on at least 60 of the 65 snapshot days, 3,900 accounts (62.5 percent) finished the window with fewer followers than they started with, while the combined follower total of those same 6,236 accounts rose from 27,599,661,489 to 28,039,339,069. That is a net gain of 439,677,580 followers, or 1.59 percent. The typical account shrank. The pile grew. One hundred accounts out of 6,236 took 53.8 percent of the net gain.
What does a normal day look like for a tracked X account?
Boring and slightly negative. Our X engine recorded a median daily change of minus 25 followers across 469,662 consecutive-day observations of 14,484 accounts. The interquartile range runs from minus 88 to plus 77. You have to reach the 95th percentile before you find a day worth writing about, and even then it is plus 2,807 followers on accounts whose median size is above two million.
The table below gives the distribution of one-day follower changes across those 469,662 consecutive-day observations, measured between 2026-06-09 and 2026-09-02. Note how far the mean sits from the median: the two disagree by 760 followers, which is what a distribution with a long right tail and a short left one looks like when you summarize it two ways.
| Percentile | Follower change that day |
|---|---|
| 5th | -327 |
| 25th | -88 |
| 50th (median) | -25 |
| 75th | +77 |
| 95th | +2,807 |
| Mean | +735.4 |
We ran the same question a second way to be sure we understood the table. Taking only the 8,011 accounts with at least 30 consecutive-day observations, computing each account's own median daily change, then taking the median across accounts, the answer was minus 33 followers per day, with 5,270 accounts (65.8 percent) typically losing, 21 flat and 2,720 typically gaining. Two independent formulations, same sign, same order of magnitude. A cross-platform companion piece on why most social accounts are shrinking across six million daily snapshots found the same direction on a wider sample; this article is the X-only, day-resolution version.
Does a daily_growth of zero mean no change, or no measurement?
A zero means no change, and we checked rather than assumed. Of the 496,745 rows where daily_growth is populated, exactly 2,284 hold the value zero. All 2,284 of them carry a followers_eod value identical to that account's previous observation. Zero rows with identical follower counts carry a null instead. Unmeasured is encoded as null in this table, and a zero is a real reading.
That distinction matters because misreading zeros in either direction distorts churn. Had we treated zeros as missing, we would have discarded genuine no-change days. Had we treated nulls as zeros, we would have manufactured 51,259 fake flat days and pulled the loss rate down by roughly nine percentage points. The zeros are also rare, at 0.46 percent of populated rows, which is what a panel whose median account carries 321,978 followers should produce. An account that size almost never lands on the same number twice.
| Column | Rows populated of 548,004 | Null share |
|---|---|---|
| followers_eod | 548,004 | 0% |
| tweets_eod | 548,004 | 0% |
| daily_growth | 496,745 | 9.4% |
| growth_pct | 496,743 | 9.4% |
The nulls are not scattered noise either. Of the 51,259 null daily_growth rows, 48,967 are the first snapshot of an account, one for every account in the table, where no prior reading exists to difference against. That leaves 2,292 later rows, or 0.42 percent of the table, as genuine gaps.
Why daily needed a filter before it meant anything
We verified what daily_growth actually holds. On all 496,745 populated rows it equals followers_eod minus that account's previous followers_eod, with zero mismatches. It is a since-last-observation delta, not a guaranteed one-day delta. Whether it covers one day or nine depends on whether our crawler ran.
It often did not. The 548,004 rows cover 65 distinct snapshot days inside an 86-day calendar window, so 21 days hold no snapshot at all: a 13-day outage from 2026-06-10 to 2026-06-22, a six-day outage from 2026-07-13 to 2026-07-18, plus 2026-07-23 and 2026-08-06. Every per-day figure here is therefore restricted to rows whose previous observation was exactly one calendar day earlier. Skipping that filter would inflate loss magnitudes by folding multi-day gaps into single-day numbers.
| Days spanned by the delta | Rows | Share of populated rows |
|---|---|---|
| Exactly 1 day | 469,662 | 94.6% |
| 2 days | 17,105 | 3.4% |
| 3 to 7 days | 9,978 | 2.0% |
| More than 7 days | 2,292 | 0.5% |
What size of account is actually in this table?
Large ones, and saying so out loud is the difference between an honest article and a misleading one. Taking the last observation for each of the 48,967 accounts, the 10th percentile is 60,197 followers, the median is 321,978, the 90th percentile is 1,889,486 and the largest is 241,540,469. This is not a sample of ordinary X accounts. It is the slice of our directory that we resync every day.
The daily panel narrows further still. The median account in this table has exactly one snapshot: 34,478 of 48,967 accounts (70.4 percent) were captured once and never again, 4,881 twice, and only 6,236 accounts (12.7 percent) reached 60 or more snapshots. Almost every consecutive-day observation belongs to an account above one million followers. For the population view of what an ordinary account holds, our X follower count benchmarks measured across 17 million accounts covers it, and the X account directory is where this daily panel is drawn from.
| Follower tier | Consecutive-day observations | Accounts | Share negative | Median daily change |
|---|---|---|---|---|
| 250,000 to 500,000 | 1,830 | 1,830 | 53.2% | -2 |
| 500,000 to 1,000,000 | 2,446 | 2,446 | 65.3% | -6 |
| 1,000,000 to 5,000,000 | 389,653 | 8,986 | 64.5% | -25 |
| 5,000,000 and above | 75,732 | 1,284 | 56.6% | -41 |
Read the top two rows carefully. Each of those accounts contributed exactly one consecutive-day pair, so those tiers are a single coin flip per account rather than a time series, and we would not price anything off them. The bottom two rows carry 465,385 of the 469,662 observations. As a share of base, the largest accounts bleed least: the median day costs an account above five million followers 0.0005 percent of its following, against 0.0012 percent in the one-to-five-million tier.
How much do the shrinking accounts actually lose?
Far less than the losing share suggests. Across the 6,236 accounts captured on at least 60 of 65 days, whose median starting size was 2,587,283 followers, the median account finished down 3,150 followers, or minus 0.125 percent over 86 calendar days. Not one account in the panel lost 5 percent or more of its following. Meanwhile 414 accounts (6.6 percent) gained 5 percent or more.
That asymmetry is the shape worth remembering. Decline is broad and shallow; growth is narrow and steep. The 3,900 losing accounts shed 37,874,307 followers between them, an average of 9,711 each. The 2,336 gaining accounts added 477,551,887, an average of 204,432 each, which is twenty-one times as much movement per account. If you are pricing a listing on the live account marketplace, a mild negative slope is the default condition of a large X account, not a defect to discount hard for.
| Outcome over 2026-06-09 to 2026-09-02 | Accounts | Share of 6,236 |
|---|---|---|
| Finished with fewer followers | 3,900 | 62.5% |
| Finished with more followers | 2,336 | 37.5% |
| Finished exactly level | 0 | 0% |
| Lost 5% or more | 0 | 0% |
| Gained 5% or more | 414 | 6.6% |
Why did the total rise while the typical account fell?
Because gains concentrate and losses do not. The same 6,236 accounts added 439,677,580 followers net over the window, a 1.59 percent rise on a base of 27,599,661,489. The top 10 accounts by absolute change contributed 45,654,011 of that, and the top 100 contributed 236,682,530, or 53.8 percent of the net gain from 1.6 percent of the panel.
Any aggregate follower statistic you read about X is therefore describing roughly a hundred accounts. The median experience runs the other way. This is the same arithmetic that lets a mean of plus 735.4 followers per day coexist with a median of minus 25, and it is why we quote medians throughout. Our X follower rank tool, which we still publish under its older Twitter name, exists for the same reason: knowing where a count sits in the distribution beats knowing the average.
Is posting more associated with gaining followers?
Yes, consistently, and the association is monotonic across every bucket we cut. First a correction to how the column reads: tweets_eod is a cumulative lifetime post count, not a daily one. Its median value is 22,180 and it rises or holds on 96.2 percent of consecutive rows. Posting volume has to be computed as the difference between consecutive readings.
Having differenced it, restricted the sample to accounts above one million followers, and dropped the 15,574 observations where the count fell (net deletions, which we cannot interpret), the pattern is clean. On the 251,839 observations where an account posted nothing, 23.6 percent gained followers and the median day cost 42 followers. On the 5,275 observations where an account posted more than 200 times, 72.7 percent gained and the median day added 151.
| Posts that day | Observations | Accounts | Share gaining | Median follower change | Median followers |
|---|---|---|---|---|---|
| 0 | 251,839 | 9,254 | 23.6% | -42 | 2,238,971 |
| 1 to 2 | 59,135 | 6,701 | 42.7% | -16 | 2,196,898 |
| 3 to 5 | 34,201 | 5,239 | 48.3% | -4 | 2,166,824 |
| 6 to 10 | 26,969 | 4,297 | 52.0% | +6 | 2,163,142 |
| 11 to 25 | 31,065 | 3,686 | 57.8% | +28 | 2,242,056 |
| 26 to 50 | 18,313 | 2,423 | 62.7% | +53 | 2,331,531 |
| 51 to 200 | 23,118 | 1,589 | 68.1% | +78 | 2,417,537 |
| More than 200 | 5,275 | 423 | 72.7% | +151 | 2,861,127 |
The breakeven sits between the three-to-five bucket and the six-to-ten bucket. Below it, the median large account we measured shrank; above it, the median account held or grew. The rightmost column is there deliberately: median account size stays between 2.16 million and 2.42 million across seven of the eight buckets, so the ladder is not an artifact of bigger accounts posting more. One further number worth sitting with: on 254,509 of 469,659 consecutive-day observations (54.2 percent), these accounts posted nothing at all.
Does the posting pattern survive holding the account fixed?
Partly, which is the honest answer rather than the marketable one. A cross-sectional ladder like the one above can be produced entirely by account identity: dormant accounts post nothing and bleed, live accounts post and grow, and no daily decision by any operator is involved. So we compared each account against itself.
We took the 635 accounts with at least 10 zero-post days and at least 10 days of six or more posts inside the same window, then compared each account's median growth rate on its own active days against its own quiet days. 421 of 635 accounts (66.3 percent) did better on their active days. 214 (33.7 percent) did not. Across the 635, the median quiet-day rate was minus 0.0003 percent and the median active-day rate plus 0.0013 percent, a within-account difference of 0.0018 percentage points.
The relationship is therefore associational and holds for roughly two accounts in three, not as a law. We ran no experiment, we cannot rule out reverse causation (an account having a good day posts more because it is having a good day), and a third of the accounts we could test contradict the pattern outright. Anyone modeling a target rate should test it against a specific account's own history rather than the population curve, which is what our follower growth simulator is built for.
| Within-account comparison, 635 accounts | Result |
|---|---|
| Better median rate on active days | 421 (66.3%) |
| Same or worse on active days | 214 (33.7%) |
| Median rate, zero-post days | -0.0003% |
| Median rate, six-or-more-post days | +0.0013% |
What we measured and then refused to publish
Four findings died in review, and each one would have read well, which is exactly why they are listed here. Publishing a measurement engine's output means publishing what it rules out alongside what it supports, and on a table nobody has written an article from before, the rejections carry as much information as the headline does.
The first was a day-of-week effect. Snapshot volume in this table averages 18,934 rows on a Tuesday against 7,911 on a Monday, a 2.4x swing that is entirely our own cron schedule rather than anything X accounts are doing. Any weekday growth pattern computed on this table would be measuring our crawler, so we did not compute one, and we would treat anyone else's weekday chart drawn from a directory snapshot with the same suspicion.
The second was a tidy null rule. Later-row nulls number 2,292, and deltas spanning more than seven days also number 2,292, which looked like a deliberate guard against attributing a long gap to a single day. Intersecting the two sets killed it: only 1,344 rows appear in both, so the matching totals are a coincidence. The third was a collapse statistic. Exactly one consecutive-day observation shows a fall of 2,322,982 followers to zero, and two show gains above 100 percent; those are suspensions and resets rather than growth, and they are excluded from every figure above.
The fourth was the phrase "average X account growth" itself, which we cut from the framing of this piece. The median account in this panel holds 321,978 followers and the consecutive-day rows sit almost entirely above one million, so nothing here describes an ordinary account. There is also one limitation we cannot engineer away: the balanced panel requires 60 snapshots, so any account suspended or deleted mid-window is absent from it by construction. The 62.5 percent decline rate is a floor, not a ceiling.
What should a buyer or seller do with this?
Stop treating a flat or mildly falling follower count as a red flag. It is the modal outcome for a large X account: 62.5 percent of the 6,236 accounts we tracked on 60 or more days ended lower, and the median loss was 0.125 percent over roughly three months. A seller showing three months of history with a small negative slope is showing you a normal account.
Do treat a stalled posting cadence as a real signal, because it travels with the follower line. Accounts posting nothing gained on 23.6 percent of days; accounts posting six to ten times gained on 52.0 percent. Ask for posting history alongside follower history, and check what the followers are made of before agreeing a price, which is the job our follower audit tool does. On price itself, our breakdown of what you should actually pay for an X account in 2026 is the companion to this piece, and from the other side of the table you can list an account for sale with that history attached.
Questions about X follower growth, answered from the snapshots
What is the average daily follower growth on X?
Across 469,662 consecutive-day observations of 14,484 X accounts measured between 2026-06-09 and 2026-09-02, the mean was plus 735.4 followers per day and the median was minus 25. Use the median. The mean is dragged up by a small number of very large accounts, and reporting it as typical would misdescribe the 63.2 percent of observations that were losses.
Do most X accounts lose followers?
Most of the large ones we track do, on most days. 63.2 percent of 469,662 consecutive-day observations were net losses, and 3,900 of 6,236 accounts (62.5 percent) tracked on at least 60 days finished the window lower. This panel skews heavily toward accounts above one million followers, so it describes established accounts, not new ones.
How many followers does a big account lose per day?
The median one-day change was minus 25 followers for accounts in the one-to-five-million tier (389,653 observations) and minus 41 for accounts above five million (75,732 observations). As a share of following that is 0.0012 percent and 0.0005 percent respectively, so the largest accounts lose the most followers and the smallest fraction of them.
Does posting more actually grow an X account?
It is associated with growth, and we cannot show that it causes growth. Among accounts above one million followers, days with zero posts gained on 23.6 percent of 251,839 observations; days with more than 200 posts gained on 72.7 percent of 5,275. Holding the account fixed, 421 of 635 comparable accounts (66.3 percent) did better on their own active days. A third did not.
How many posts per day does it take to stop shrinking?
In our data the crossover sits at roughly six posts a day. Accounts above one million followers posting three to five times had a median change of minus 4 followers; posting six to ten times, the median change was plus 6. Median account size holds near 2.2 million across both buckets, so size is not driving the difference. That is a description of what we observed, not a target we can promise works.
Can I trust a seller's screenshot of follower growth?
Only if it covers a continuous window. Our own table shows why: 21 of the 86 calendar days between 2026-06-09 and 2026-09-02 hold no snapshot at all, and a delta that quietly spans nine days looks like a catastrophic single day. Ask for dated, consecutive readings, and cross-check the account's position against a public ranking rather than a screenshot.
Is a shrinking follower count a reason to walk away from a deal?
On its own, no. Zero of the 6,236 accounts in our balanced panel lost 5 percent or more over 86 days, so ordinary decline is small: the median was minus 0.125 percent. A fall steeper than a few percent in three months sits outside everything we measured and is worth investigating. A flat line combined with zero posting is a dormant account, which is a different problem from a declining one.
Related Articles
Continue learning with these related guides.
Does Twitch Account Age Still Matter? We Measured 432,192
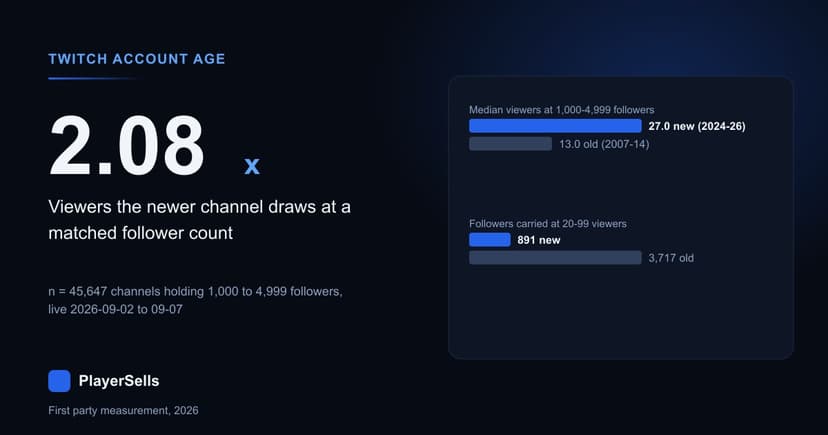
Across 432,192 Twitch channels read on 2026-09-08, account age is almost pure accumulation, and at a matched follower count the newer channel wins.
X Bookmark Rate Benchmarks From 94,318 Scored Accounts
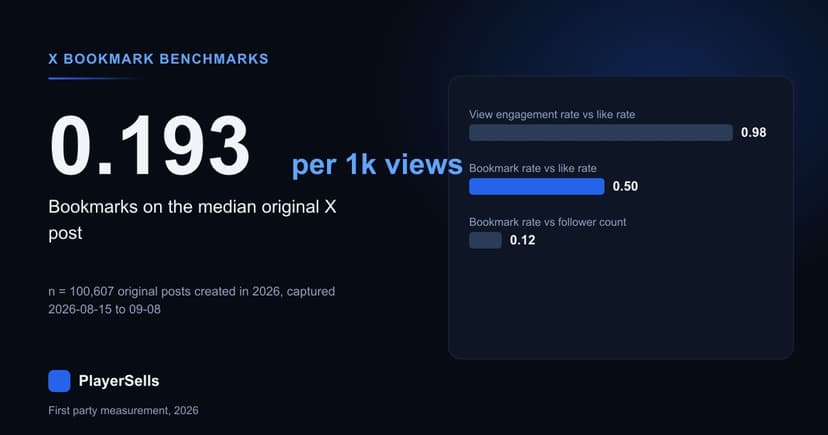
Half the X accounts we scored on ten or more posts bookmark under 0.0273% of their views, and a third of original posts get no bookmarks at all.