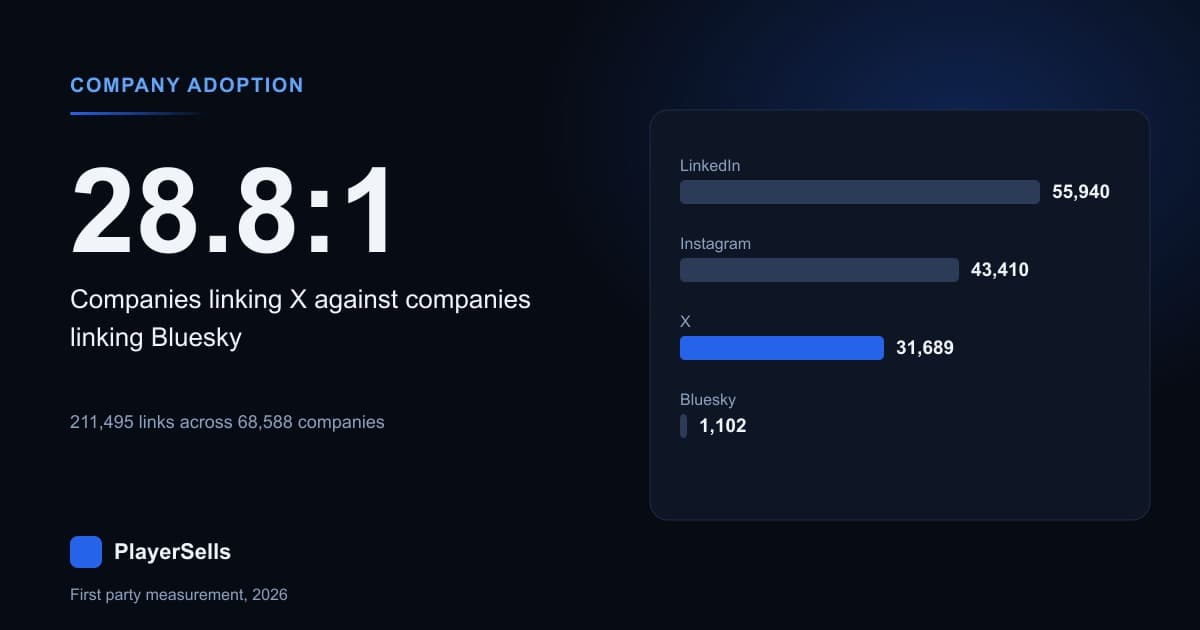
Companies link an X account 29 times more often than they link a Bluesky account. We measured that across 68,588 companies and 211,495 verified social links in our own LinkedIn company directory, crawled between 2026-08-22 and 2026-09-02. X appears on 31,689 company websites, Bluesky on 1,102, a ratio of 28.8 to 1. On the evidence of what businesses publish on their own sites in 2026, the corporate migration away from X has not happened.
The rest of the census is argued about less and useful more. Of the 106,667 companies whose website we resolved, 64.30% published at least one social link. LinkedIn led at 52.44%, Instagram at 40.70%, Facebook at 37.10%, X at 29.71% and YouTube at 27.75%. TikTok reached 7.21%. GitHub, Bluesky and Telegram each sat at or below 1.51%. Every figure here comes from links we extracted ourselves, not from a survey of marketers reporting their own behaviour.
What this census actually covers
The sampling frame matters more than the headline, so it goes first. Our directory holds 112,818 companies, of which 106,667 have a website domain we resolved. The links come from exactly one place: the source column reads "website" on all 211,495 rows, with no second value. We did not read these links off LinkedIn pages, press releases or a purchased dataset. We fetched each company's own site and recorded what it linked out to.
That gates the census hard, and we verified the gate rather than assuming it. Cross-tabulating "has a resolved website domain" against "appears in the social census" produces no cell at all for companies without a site: zero of the 6,151 website-less companies contribute a single row. So the denominator below is 106,667, not 112,818, and the unit being measured is a public link on a corporate website. It is not account ownership.
A second constraint belongs up front because it disqualifies one row of our own table. The company universe was discovered through LinkedIn, so every company in it has a LinkedIn page by construction. LinkedIn topping the adoption ranking is therefore partly circular, and we do not present it as a finding. The defensible version is narrower and more interesting: 52.44% of these companies link their LinkedIn page from their own website, which means 47.56% do not bother. Our LinkedIn company page benchmarks measured across 29,742 pages cover what those pages do once you reach them.
Which platforms do companies actually link?
This table counts distinct companies carrying at least one link to each platform, measured across the full 12-day crawl. The middle column uses all 106,667 resolved companies as its denominator. The right column uses only the 68,588 companies that published any social link at all, which is the fairer number if you want to know what an active company's stack looks like.
| Platform | Companies linking it | Share of 106,667 resolved | Share of 68,588 with any link |
|---|---|---|---|
| 55,940 | 52.44% | 81.56% | |
| 43,410 | 40.70% | 63.29% | |
| 39,575 | 37.10% | 57.70% | |
| X | 31,689 | 29.71% | 46.20% |
| YouTube | 29,605 | 27.75% | 43.16% |
| TikTok | 7,694 | 7.21% | 11.22% |
| GitHub | 1,611 | 1.51% | 2.35% |
| Bluesky | 1,102 | 1.03% | 1.61% |
| Telegram | 869 | 0.81% | 1.27% |
One row needs a haircut before you quote it. Our extractor sometimes captures a URL path segment as a handle, so 1,314 of the 39,575 Facebook rows carry handles like "people", "pages", "groups" or "docs", which are Facebook URL structure rather than company pages. That is 3.32% of the Facebook total. Instagram loses 167 rows to the same bug, LinkedIn 132, X only 20. Netting Facebook down to 38,261 leaves the ordering unchanged, so we report the ranking with confidence and the Facebook count with a stated error bar.
Have companies moved off X to Bluesky?
No, and the measurement survives every attempt we made to break it. The raw ratio is 31,689 X links to 1,102 Bluesky links, or 28.8 to 1. Because several companies link the same handle, we recomputed on distinct handles: 27,683 unique X handles against 990 unique Bluesky handles, a ratio of 28.0 to 1. Two formulations, one answer, which is the sanity check we require before publishing a ratio.
The obvious way this could have been our bug is a Bluesky extractor that shipped partway through the crawl. It did not. All nine platform extractors produced rows on all 12 days of the window, from 2026-08-22 through 2026-09-02. Recomputing the ratio day by day, X outnumbered Bluesky on every single day, in a band from 15.3 to 50.5 with no trend across the window. The 29 to 1 headline is a stable property of the data, not a startup effect in our pipeline.
Co-occurrence is where the story gets sharper. Of the 1,102 companies linking Bluesky, 685 also link X, so 62.16% of Bluesky adopters kept X on the same page. Only 417 companies in the entire census of 68,588, or 0.61%, link Bluesky without linking X. Looked at from the other side, 685 of 31,689 X-linking companies also carry Bluesky, meaning 97.84% of companies that link X show no Bluesky presence whatsoever.
Here is a comparison we ran and then refused to publish as stated. Bluesky adopters link X at 62.16% against 46.20% for the census as a whole, which reads like evidence that Bluesky adopters are unusually loyal to X. That comparison is confounded. Companies linking Bluesky run a median of 5 platforms against 3 for everyone else, n of 1,102 and 67,486, so they are more likely to link anything at all. Conditioning on platform count reverses the sign.
| Platforms the company runs | X presence, no Bluesky link | X presence, has Bluesky link | n without / with Bluesky |
|---|---|---|---|
| 2 | 27.18% | 15.87% | 13,550 / 63 |
| 3 | 41.86% | 42.07% | 16,359 / 164 |
| 4 | 63.29% | 52.99% | 15,503 / 234 |
| 5 | 88.30% | 61.30% | 9,301 / 292 |
| 6 | 99.17% | 85.98% | 1,684 / 264 |
Within companies running exactly five platforms, 61.30% of Bluesky linkers also link X against 88.30% of non-linkers. That is a substitution signal at the margin, and it is also partly mechanical, because a company with five slots that spends one on Bluesky has one fewer slot for everything else. We report both directions and claim neither as migration. A 12-day cross-section records presence, never departure, and nothing in this table can tell you whether an account was removed. Our Bluesky directory of ranked accounts and the question of whether Bluesky is dead measured on accounts rather than app sessions both approach the same platform from the consumer side.
How many platforms does one company run?
The median company in this census runs 3 platforms, the mean is 3.084, and the 90th percentile is 5. Breadth is common but not extreme: 27,431 companies, or 40.00% of the 68,588, run four or more. At the other end, 11,021 companies, or 16.07%, publish exactly one social link. No company in our crawl linked all nine platforms, and only 7 reached eight.
| Platforms linked | Companies | Share of 68,588 |
|---|---|---|
| 1 | 11,021 | 16.07% |
| 2 | 13,613 | 19.85% |
| 3 | 16,523 | 24.09% |
| 4 | 15,737 | 22.94% |
| 5 | 9,593 | 13.99% |
| 6 | 1,948 | 2.84% |
| 7 | 146 | 0.21% |
| 8 | 7 | 0.01% |
The shape of that distribution is the practical finding. Corporate social presence is not a long tail of maximalists, it is a tight cluster: 66.88% of companies sit at two, three or four platforms. Anyone selling a nine-platform content strategy is selling to the 3.06% of companies that run six or more.
What does a company pick when it picks only one?
Among the 11,021 single-platform companies we measured, the choice is not close. LinkedIn takes 75.18% of them. Instagram is a distant second at 8.81% and X third at 6.37%. TikTok and Bluesky are effectively absent as a sole channel, with 11 and 8 companies respectively out of 11,021.
| Sole platform | Companies | Share of 11,021 single-platform companies |
|---|---|---|
| 8,286 | 75.18% | |
| 971 | 8.81% | |
| X | 702 | 6.37% |
| 530 | 4.81% | |
| YouTube | 323 | 2.93% |
| GitHub | 130 | 1.18% |
| Telegram | 60 | 0.54% |
| TikTok | 11 | 0.10% |
| Bluesky | 8 | 0.07% |
Read that column with the circularity caveat attached. These companies were found through LinkedIn, so a LinkedIn-first bias is baked into the frame. The result that survives the caveat is the gap between second and ninth place: when a company commits to one consumer platform, Instagram beats X, and both beat TikTok by two orders of magnitude.
Does the platform mix change with company size?
It does, and in two opposite directions at once. This table uses size_band from our company records and takes the denominator as companies in that band where we resolved at least one link, which is the honest base once you accept that our discovery failures are whole-site misses rather than partial ones.
| Headcount band | Companies resolved | X | YouTube | TikTok | GitHub | |
|---|---|---|---|---|---|---|
| 2-10 | 10,515 | 37.48% | 27.04% | 56.51% | 9.81% | 3.42% |
| 11-50 | 17,023 | 42.20% | 36.10% | 59.81% | 10.77% | 3.03% |
| 51-200 | 15,995 | 47.69% | 45.19% | 63.67% | 11.79% | 2.54% |
| 201-500 | 7,996 | 49.37% | 50.91% | 66.31% | 11.42% | 1.71% |
| 1,001-5,000 | 6,616 | 52.49% | 56.17% | 69.23% | 11.78% | 0.71% |
| 10,001+ | 2,779 | 60.70% | 59.55% | 72.98% | 12.23% | 0.32% |
YouTube shows the steepest size gradient of any platform we measured, rising from 27.04% of small companies to 59.55% of the largest, a 2.2x spread. X rises 1.6x across the same range. TikTok is remarkably flat, moving only from 9.81% to 12.23%, which is a genuine result: TikTok adoption is not a budget question. GitHub runs the other way entirely, falling 10.7x from 3.42% to 0.32%.
The GitHub gradient is not about size. Cutting by industry instead, GitHub links appear on 10.21% of the 6,138 Software Development companies and 9.56% of the 2,970 Technology and Internet companies, against 1.59% of 3,516 Financial Services companies and 0.12% of 823 Retail companies. Small firms in our sample skew software, so the apparent size effect is industry composition wearing a headcount costume. We report the industry cut and discard the size reading.
Why the largest companies look absent, and why that is our crawler
Here is the finding we killed. Measured against every company with a resolved website, the share publishing any social link peaks at 70.52% for the 51-200 employee band and falls to 57.18% for companies over 10,000 employees. Written up carelessly that becomes "large enterprises use social media less", which would have been a nice contrarian headline and is almost certainly false.
The test that killed it: if enterprises genuinely used social less, the ones we did resolve would also run fewer platforms. They run more, monotonically. Mean platform count rises without a single reversal from 2.39 at one employee, through 2.88 at 11-50 and 3.31 at 201-500, to 3.68 at 10,001 and above. A group cannot simultaneously be less social and broader on every platform we count.
The reading that fits both facts is a crawler artifact. Large-enterprise websites defeat link extraction more often than small ones do, through JavaScript-rendered footers, regional gateway pages and consent walls, and when they defeat it they defeat it entirely, producing a company with zero links rather than a company with three. The dip measures our extractor, not enterprise behaviour, so the only size claim we publish is the conditional one: among companies we resolved, breadth rises with headcount from a median of 2 platforms at 2-10 employees to 4 at 10,001 and above.
Is TikTok a business platform yet?
Not on this evidence. TikTok appears on 7,694 company sites, 7.21% of the 106,667 we resolved, against 40.70% for Instagram. A company in our census is 5.6 times more likely to link Instagram than TikTok, and the ratio barely moves with company size. That gap is worth holding next to the consumer picture, where TikTok audiences are enormous, because it says corporate adoption and consumer attention are running years apart.
For anyone pricing an account, that asymmetry is the point rather than a footnote. Business demand for a distribution channel and audience size on that channel are different quantities, and they diverge most exactly where the buying opportunity sits. You can check where a given handle lands against our directory with the TikTok follower rank tool, and see what is currently trading on the live account marketplace.
What the follower column can and cannot tell you
Our records carry a follower count on 29,532 of the 211,495 links, which the brief for this piece put at 29,482. The correction is small and the caveat behind it is not. That column is populated only where the handle matched a record in one of our own platform directories: matched_ref, matched_at and followers have identical row counts on all nine platforms, which is the signature of a join rather than a measurement. Facebook, Instagram, LinkedIn and GitHub sit at exactly zero because we run no directory for them.
| Platform | Links matched to our directory | Match rate | Median followers | 90th percentile |
|---|---|---|---|---|
| X | 20,254 | 63.9% | 7,262 | 174,953 |
| TikTok | 7,405 | 96.2% | 6,492 | 327,583 |
| Telegram | 625 | 71.9% | 2,406 | 43,389 |
| Bluesky | 1,059 | 96.1% | 644 | 10,724 |
YouTube is missing from that table deliberately. Only 140 of 29,605 YouTube links matched, a rate of 0.47%, because company sites link channels by name while our directory is keyed differently. The 140 that did match have a median of 506,000 subscribers, which is not a benchmark, it is a list of famous channels that happened to resolve. Publishing it would have been the most quotable wrong number in this article.
The X and Bluesky medians are worth sitting with. The median company X account we could match holds 7,262 followers and the median matched Bluesky account holds 644, both far below what platform-level averages imply, because corporate accounts are mostly small. Compare a specific handle against the full distribution using the X follower rank tool or the Bluesky follower rank tool, and see the underlying population in our directory of ranked X accounts.
Two more integrity notes on that column. Follower values are point-in-time readings taken when the match ran, so four records for the same handle in our crawl differ by thousands across the 12 days. And the single largest Bluesky value, 34,753,183, belongs to the handle "bsky.app", which is the platform's own account captured when a company linked the Bluesky homepage instead of a profile. Impossible values are rare, one row above 2,000,000 in 1,062 Bluesky matches, but they exist and we excluded them from the reasoning above.
What a buyer or seller should take from this
Corporate presence is a demand signal, and it points somewhere unfashionable. X sits on 31,689 company websites against Bluesky's 1,102, so an X account addresses a market where businesses already operate, while a Bluesky account addresses one where 0.61% of companies have committed without hedging. That is not a verdict on either platform's future. It is a measurement of where corporate attention sits in 2026.
The multi-platform pattern matters too. With a median of 3 platforms per company and 40.00% running four or more, buyers acquiring a single account are usually buying into a stack that already exists rather than replacing one. Sellers should note the same thing from the other direction: the 5.6 to 1 Instagram-to-TikTok gap in corporate linking is a statement about who is bidding. Compare that against what is actually trading: buy an Instagram account in the category corporate buyers favour most, or list an account for sale if you already hold one.
Questions about company social platform adoption
The questions below come up whenever we publish adoption data, usually about the denominator or the discovery path. Short answers with the relevant numbers attached.
How many companies did you actually measure?
We resolved 106,667 company websites out of 112,818 companies in our directory, and 68,588 of them published at least one social link, a rate of 64.30%. Those 68,588 companies produced 211,495 links across nine platforms between 2026-08-22 and 2026-09-02. Percentages in this article use 106,667 as the denominator unless the table says otherwise.
Does a missing link mean the company has no account?
No, and this is the single most important limit on the data. We measure links published on a company's own website, so a company that runs a TikTok account without linking it from its site appears here as a non-adopter. Every number in this article is a floor on true account ownership, never a ceiling, and the gap is likely largest for platforms companies treat as experimental.
Is the 29 to 1 X to Bluesky ratio robust?
It held under three checks. On raw links it is 28.8 to 1, on distinct handles 28.0 to 1, and computed separately for each of the 12 crawl days it never fell below 15.3 to 1. All nine extractors ran on all 12 days, so it is not an artifact of a Bluesky parser shipping late. We consider the ratio measured rather than estimated.
Why is LinkedIn excluded from your conclusions?
Because the sample is circular for that one platform. Our 112,818 companies were discovered through LinkedIn, so all of them have a LinkedIn page by construction and its 52.44% adoption rate measures whether they link it, not whether they have it. We report the number and decline to rank it against the others.
Did you find companies sharing the same social account?
Yes, roughly 9% to 13% of links per platform point at a handle another company also links. The largest cases are member-firm networks: 62 separate company records link the same KPMG accounts, 52 link the same Justice Department accounts and 49 link the same Accenture accounts. Distinct-handle counts run 27,683 for X and 990 for Bluesky against 31,689 and 1,102 raw links.
What could not be measured from these tables?
Change of any kind. The crawl window is 12 days and a link's first observation is simply the day we fetched the site, so we can count presence and never departure or addition. Engagement, posting frequency and account age are also absent from these records. Anything in this article phrased as a trend would be an invention, which is why nothing here is.
Related Articles
Continue learning with these related guides.
Does Twitch Account Age Still Matter? We Measured 432,192
Across 432,192 Twitch channels read on 2026-09-08, account age is almost pure accumulation, and at a matched follower count the newer channel wins.
X Bookmark Rate Benchmarks From 94,318 Scored Accounts
Half the X accounts we scored on ten or more posts bookmark under 0.0273% of their views, and a third of original posts get no bookmarks at all.