What Is a Good Engagement Rate on X? 27,844 Measured
The median X account near 100,000 followers posts at 0.072% engagement per follower and 0.010% above a million, measured on 27,844 scored accounts.

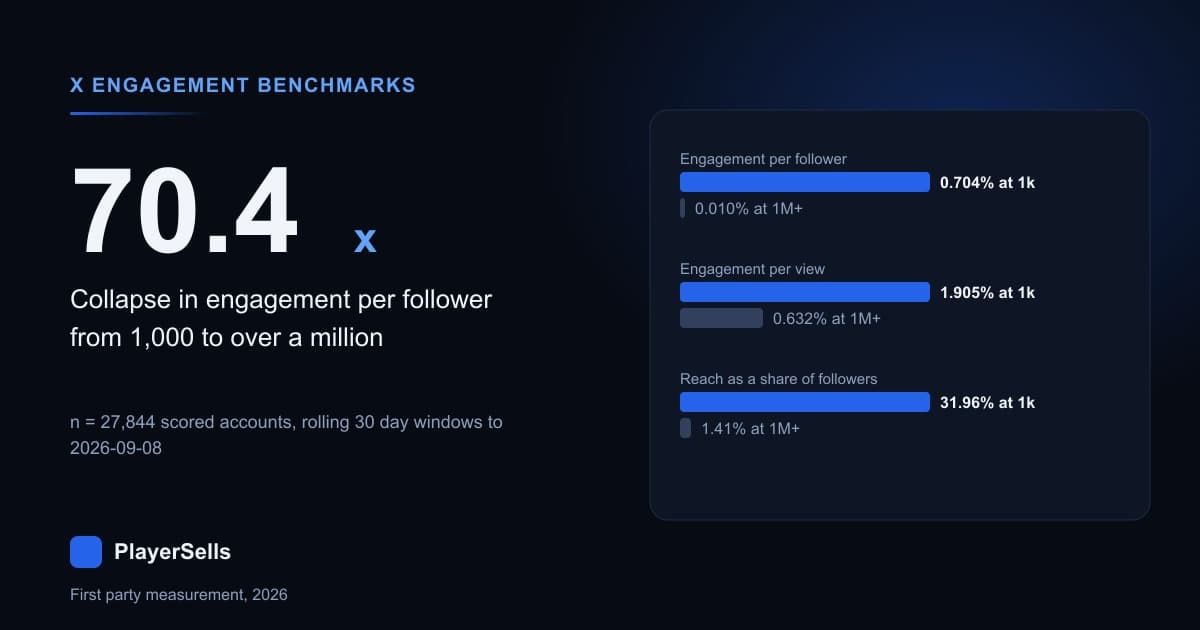
The median X account we scored posts at an engagement rate of 0.072% of its followers at roughly 87,700 followers, and 0.010% at 1.8 million, measured on 27,844 accounts drawn from the 94,395 our engine had scored on rolling 30 day windows between 2026-08-17 and 2026-09-08. That is a 70.4x collapse across three orders of magnitude of audience. Over the same accounts in the same window, engagement measured against views falls only 3.0x. The difference between those two numbers is the whole story of 2026 X benchmarks: what dies as an account grows is not the reaction rate, it is distribution.
So the short answer depends entirely on which denominator you use, and almost every published benchmark picks the wrong one and then computes it as a mean. Every figure here comes from a query we ran against our own X engine on 2026-09-08, and every row carries its n.
What is a good engagement rate on X in 2026?
The table below is the benchmark. The cohort is 27,844 accounts where our engine sampled at least ten posts inside the 30 day window and where retweets make up no more than 10% of the sampled timeline. That second filter matters more than it sounds, and section seven explains why. Engagement here is likes plus retweets plus replies plus quotes, which we confirmed as the exact composition of the stored field on 62,779 sampled tweets.
| Follower band | Accounts | Median followers | P10 | P25 | Median | P75 | P90 | P95 |
|---|---|---|---|---|---|---|---|---|
| About 1,000 | 1,443 | 997 | 0.000% | 0.200% | 0.704% | 3.009% | 14.395% | 52.650% |
| About 10,000 | 5,072 | 9,845 | 0.010% | 0.046% | 0.265% | 1.052% | 3.123% | 6.152% |
| About 100,000 | 7,892 | 87,724 | 0.002% | 0.011% | 0.072% | 0.323% | 1.091% | 1.980% |
| 100k to 500k | 6,597 | 341,334 | 0.001% | 0.004% | 0.031% | 0.160% | 0.565% | 1.121% |
| 500k to 1M | 3,558 | 666,991 | 0.000% | 0.002% | 0.016% | 0.090% | 0.335% | 0.705% |
| 1M and above | 3,282 | 1,813,088 | 0.000% | 0.001% | 0.010% | 0.049% | 0.167% | 0.306% |
Read P75 as "good" and P90 as "top decile for your size". An account at 87,724 followers holding 0.323% beats three quarters of its size peers. The same 0.323% at 9,845 followers is below the median. A single global threshold, the kind repeated as "0.5% is healthy on Twitter", is meaningless without a follower band attached, which is why our engagement rate calculator asks for the band first.
Why is every published benchmark higher than the rate you actually get?
Because published benchmarks average. Our stored rate divides the account's median post engagement by its follower count. Recomputing the same accounts with the mean post instead, which is the industry convention, moves every band up, and it moves the small ones furthest.
| Follower band | Accounts | Median post rate | Mean post rate | Inflation |
|---|---|---|---|---|
| About 1,000 | 1,443 | 0.704% | 6.726% | 9.6x |
| About 10,000 | 5,072 | 0.265% | 0.961% | 3.6x |
| About 100,000 | 7,892 | 0.072% | 0.193% | 2.7x |
| 100k to 500k | 6,597 | 0.031% | 0.073% | 2.4x |
| 500k to 1M | 3,558 | 0.016% | 0.038% | 2.4x |
| 1M and above | 3,282 | 0.010% | 0.023% | 2.3x |
An account with 997 followers and one post that reached far outside its follower graph will show a mean rate nearly ten times its median rate. Nothing about the account changed. The estimator did. The median tells you what a normal post does. The mean tells you what the best post did. Only one of them is what you get next Tuesday.
Why we threw out our own decile table
Our engagement table carries a stored field called peer_group, holding values d01 through d10 on 56,118 of the 105,513 scored rows, at 5,610 to 5,612 accounts per decile. It looks like a ready made benchmark. We reproduced the mean engagement rate per decile and got d01 at 59.23%, then d02 at 2.61%, then d03 back up at 4.18%. A decile that is not monotonic is a decile that is not measuring what its name says.
| Stored decile | Accounts | Median followers | Lowest follower count in decile | Highest | Mean rate | Median rate |
|---|---|---|---|---|---|---|
| d01 | 5,612 | 998 | 993 | 9,725 | 59.23% | 1.001% |
| d02 | 5,612 | 9,801 | 9,725 | 9,879 | 2.61% | 0.330% |
| d03 | 5,612 | 9,958 | 9,879 | 80,200 | 4.18% | 0.344% |
| d04 | 5,612 | 83,304 | 80,200 | 86,617 | 0.56% | 0.109% |
| d05 | 5,612 | 90,300 | 86,619 | 128,805 | 0.52% | 0.093% |
| d06 | 5,612 | 98,838 | 94,370 | 293,562 | 0.55% | 0.098% |
| d07 | 5,612 | 334,303 | 293,566 | 1,073,846 | 0.25% | 0.048% |
| d08 | 5,612 | 462,046 | 386,426 | 565,642 | 0.22% | 0.039% |
| d09 | 5,610 | 735,754 | 565,650 | 1,095,614 | 0.18% | 0.031% |
| d10 | 5,611 | 1,841,538 | 1,052,421 | 241,600,988 | 0.09% | 0.017% |
Two things fall out of that table. The stored decile is a decile of follower count, not of engagement: median followers rise cleanly from 998 to 1,841,538. But the boundaries leak. The highest follower count in d07 is 1,073,846 while the lowest in d08 is 386,426, an overlap of 687,420 followers between two supposedly adjacent bands. Deciles were stamped onto rows as they were computed across a 22 day window while the scored population kept growing, so an early row sits in a decile drawn against a much smaller population than a late one.
The practical effect is that d02 and d03 have median follower counts of 9,801 and 9,958. They are the same size band split arbitrarily, which is exactly why their medians of 0.330% and 0.344% come out in the wrong order. We rebuilt the benchmark on raw follower bands instead, and that table is monotonic at every percentile.
What is this sample actually a sample of?
Most benchmark articles never publish this part, and skipping it is how a crawl artifact becomes an industry fact. Our scored population is not a random sample of X. It is what our tweet scanner has reached, and the scanner works down a tiered queue ordered by follower count.
| Cluster | Accounts scored | Lowest follower count | Highest |
|---|---|---|---|
| Under 1,000 | 11,661 | 993 | 999 |
| 1,000 to 9,999 | 24,063 | 1,001 | 9,999 |
| 10,000 to 99,999 | 29,203 | 78,299 | 99,999 |
| 100,000 to 999,999 | 32,218 | 100,000 | 999,375 |
| 1M and above | 8,368 | 1,000,130 | 241,600,988 |
Look at the third row. We hold 29,203 scored accounts in the 10,000 to 99,999 range and every one of them sits between 78,299 and 99,999 followers. There is nothing at 25,000 followers because the scanner has not got there yet. A 2% block sample of our 20.3 million account X directory, 405,273 rows, shows the mechanism: the queue is split into tiers, and the share already scanned is 99.6% for the 1M and above tier, 29.1% for 100k to 1M, 3.7% for 10k to 100k, and 0.33% for everything under 10,000.
So the bands in our benchmark are near threshold cohorts, not random draws from their band. Read "about 100,000" as "accounts sitting just under 100,000 followers". We verified the follower figures themselves are real by joining every scored row back to the directory's independently stored follower count: all 105,486 rows matched, and the two values agree within 5% on 96.6% to 99.6% of rows depending on the cluster. For the size distribution rather than the engagement one, our X follower count benchmarks across 17 million accounts use the full directory instead of this scored subset.
How fast does engagement decay as an account grows?
From a median of 0.704% at 997 followers to 0.010% at 1,813,088 followers is a factor of 70.4, spread over 3.26 orders of magnitude. That works out to roughly 3.7x of decay for every tenfold increase in follower count, and the decay is steady band to band: 2.7x from the 1,000 band to the 10,000 band, 3.7x from there to the 100,000 band, and 7.2x across the remaining 1.3 orders of magnitude up to 1.8 million.
The percentiles decay at the same slope as the median. The P90 rate falls from 14.395% to 0.167%, a factor of 86. Size does not compress the distribution, it shifts the whole thing down. Anyone comparing a 900,000 follower account against a 9,000 follower account on raw engagement rate is measuring the follower gap twice. The comparison only means something inside a band, and our X account directory holds the same account population this benchmark was drawn from.
Is the collapse about engagement, or about reach?
It is about reach. Our engine stores two other rates on the same accounts: reach ratio, which is median views divided by followers, and view engagement rate, which is median engagement divided by median views. We reproduced both formulas from their components before using them, matching on 97.6% and 89.5% of the 94,395 populated rows respectively.
| Follower band | Accounts | Median reach ratio | P90 reach ratio | Share with reach above 100% | Median view engagement rate | P90 view engagement rate |
|---|---|---|---|---|---|---|
| About 1,000 | 1,443 | 31.96% | 646.01% | 24.74% | 1.905% | 7.196% |
| About 10,000 | 5,072 | 13.12% | 107.94% | 10.98% | 1.695% | 7.785% |
| About 100,000 | 7,892 | 5.17% | 40.07% | 2.77% | 1.071% | 5.468% |
| 100k to 500k | 6,597 | 3.32% | 21.76% | 1.39% | 0.888% | 4.598% |
| 500k to 1M | 3,558 | 2.45% | 13.26% | 0.51% | 0.724% | 4.277% |
| 1M and above | 3,282 | 1.41% | 7.22% | 0.09% | 0.632% | 3.552% |
Median reach falls 22.7x from the smallest band to the largest, from a post seen by a third of the follower count to one seen by one in seventy. Median view engagement falls 3.0x over the same span, from 1.905% to 0.632%. Someone shown a post from a 1.8 million follower account reacts at roughly a third the rate of someone shown a post from a 997 follower account. That is a real gap. It is a small one next to 70x.
The fourth column is the one worth memorising. At around 1,000 followers, 24.74% of accounts have a median post that reached more people than the account has followers. At 1M and above, 0.09% do. Below roughly ten thousand followers, "engagement as a share of followers" stops being a rate at all, because most of the audience is not the follower graph. That is an association we measured across 27,844 accounts in one 30 day window, not a claim about how the ranking system works.
Why does a retweet heavy account show a 48% engagement rate?
Not for the reason we first assumed. We expected the stored median to pool retweets in with everything else, so that the retweeter inherits the original author's counters. It does not. Recomputing the rate from its stored components reproduces it exactly on 100.00% of the 49,324 accounts whose sampled original count is odd, and on 64% to 68% when that count is even, while the parity of the total post count changes nothing. The medians are taken over original posts only, and rebuilding forty of these accounts from raw tweet rows agreed: 73,440 median views across their own originals against 16,511 across every post type.
| Retweet share of timeline | Accounts | Median engagement rate | Median views per post | Median engagement per post |
|---|---|---|---|---|
| 0% to 10% | 1,443 | 0.704% | 319 | 7 |
| 10% to 25% | 909 | 1.055% | 407 | 10 |
| 25% to 50% | 1,504 | 2.002% | 750 | 20 |
| 50% to 75% | 1,456 | 3.559% | 1,616 | 36 |
| 75% to 100% | 2,070 | 48.013% | 37,430 | 478 |
All 7,382 accounts in that table sit between 993 and 999 followers, and the bottom row shows a median post pulling 37,430 views. What the retweet share marks is an account with almost nothing of its own left to measure. Median original posts sampled falls from 27 in the top row to 3 in the bottom row, on a timeline of about the same length. A median over three posts is not a median.
Those three posts then carry counts a 997 follower account does not generate: a median 31,084 views across 639 originals from 120 such accounts, against 318 across 4,197 originals from 120 accounts of the same size that rarely retweet. Hold the post count steady and the effect nearly disappears. Among accounts under 1,000 followers with 16 or more sampled originals, the median rate is 0.802% below 10% retweets and 1.511% above 50%. The 48% row lives in one cell: 1,811 accounts that both retweet more than half the time and have five or fewer originals. Our cohort excludes accounts above 10% retweets for that reason. If a seller quotes a 40% rate on a small account, ask how many of their own posts it covers, then read those posts in our tweet analyzer.
Should you measure against followers or against views?
Use followers when you are pricing an audience and views when you are judging content. A follower based rate answers how much of what the account owns is still responding, which is what a buyer inherits. A view based rate answers whether people shown a post act on it, and it barely moves with account size.
The failure modes are symmetric. A follower rate lies upward on small accounts, because a quarter of them at the 1,000 follower mark have median posts distributing outside the follower graph. A view rate lies upward on accounts pushed to audiences that never follow, and it says nothing about whether the audience is real, since a view is cheaper to manufacture than a reply. Checking both against a size peer group, which is what our X follower rank tool does, is more informative than optimising either one.
Does our own authenticity score add anything?
No, and we would rather say so than sell it. Our engagement table stores an authenticity score on 56,375 rows. Held at a fixed size, between 10,000 and 99,999 followers, it separates 7,190 accounts beautifully: a median engagement rate of 1.264% in its top band against 0.004% in its bottom band, a factor of 316. Then we tested whether it was independent, and the correlation between the authenticity score and an account's engagement rate percentile within the same follower range is 0.992 across 15,523 accounts.
That is a rank transform, not a second opinion. The score is a restatement of the engagement rate in percentile form, so it cannot be used to corroborate the engagement rate. It is at least uncorrelated with size, with correlations against log follower count between negative 0.106 and positive 0.058 across the six bands. Read it as this account's engagement rank among accounts its size, and nothing more.
How to use these numbers when you are buying an account
Start by putting the seller's claimed rate in the right column of the first table. A 2% engagement rate on a 90,000 follower account sits above P95 for that size, which is possible and worth verifying rather than assuming. The same 2% on a 1,000 follower account sits between the median and P75, which is good and unremarkable. One number, two situations, no comparison.
Then check the composition. Ask for a timeline where retweets are separated out and count what is left, because the table above shows the difference between a 0.7% account and a 48% account can be nothing but how little of that timeline the account actually wrote. Run the handle through a follower audit before you agree a price, and read our checklist on verifying that an X account has real followers for the rest of the due diligence sequence.
Then price against the band, not against the platform. Listings in the 10k to 50k follower tech account range and the 100k plus creator and influencer range sit against different medians: 0.1% is below median at ten thousand followers and top quartile above a million. Listings on the PlayerSells marketplace carry follower counts, which is the minimum you need to place an account in these tables.
How this was measured, and where it is weak
Everything above comes from our X engagement engine, which samples an account's recent timeline and stores per account aggregates on a rolling 30 day window. The table held 105,513 accounts when we took the snapshot on 2026-09-08, with the engagement rate populated on 94,395 and view based fields on 94,391, computed between 2026-08-17 and 2026-09-08. The window field is single valued at 30 days across every row.
We rebuilt the headline rather than trusting the stored column. A 25% block sample of the raw tweet store, filtered to original posts, recomputing each account's median engagement over its follower count at capture, gives a second set of medians from a different table. Follower count at capture is not follower count at posting, so we re-ran that rebuild restricted to posts created in 2026, which is 93.8% of the sampled originals anyway. Only the smallest band moved, from 0.803% to 0.905%; the other five held to within 0.002 points.
| Follower band | Stored cohort n | Stored median rate | Raw rebuild n | Raw rebuild median rate |
|---|---|---|---|---|
| About 1,000 | 1,443 | 0.704% | 1,833 | 0.803% |
| About 10,000 | 5,072 | 0.265% | 4,847 | 0.286% |
| About 100,000 | 7,892 | 0.072% | 6,975 | 0.085% |
| 100k to 500k | 6,597 | 0.031% | 6,171 | 0.040% |
| 500k to 1M | 3,558 | 0.016% | 4,433 | 0.023% |
| 1M and above | 3,282 | 0.010% | 6,250 | 0.017% |
Both methods give the same shape and the same ordering, and the raw rebuild sits 8% to 70% higher at every band. That bias has a known cause: the rebuild needs ten original posts inside a 25% sample, which drops the quietest accounts, and quiet accounts are the ones dragging the stored median down. Reach ratio and view engagement rate reproduce the same way: 35.42% against 31.96% at the smallest band, 1.91% against 1.41% at the largest.
Three weaknesses to hold against these numbers. The scored population is a scanner queue, not a random sample, so the bands are near threshold cohorts. Follower counts are taken at compute time, so an account that grew or shrank inside the window has a slightly wrong denominator. And every comparison here is cross sectional, measured across accounts at one moment rather than following accounts as they grow, so the decay curve describes an association between size and rate, not what will happen to your account as it gets bigger.
Questions buyers and sellers ask about X engagement rates
What is a good engagement rate on X for a 10,000 follower account?
Median is 0.265% and P75 is 1.052%, measured on 5,072 accounts sitting near ten thousand followers in our 30 day window ending 2026-09-08. Anything above 1% puts the account in the top quarter for its size. Below 0.046% puts it in the bottom quarter. These use the median post, so a single viral post will not move them.
Why is my engagement rate lower than the benchmarks I read online?
Most published benchmarks average the posts and average the accounts. Recomputing our own accounts with mean post engagement instead of median inflates the rate 2.3x at a million followers and 9.6x at a thousand. The number you read is probably not wrong arithmetic, it is a different estimator applied to a smaller and more selective sample.
Do large X accounts really have worse engagement?
They have worse engagement per follower and only slightly worse engagement per view. Across 27,844 accounts, the follower based rate falls 70.4x from the 997 follower band to the 1.8 million band while the view based rate falls 3.0x. Most of the gap is that a median post at 1M plus reaches 1.41% of the follower count.
Can an engagement rate be over 100%?
Yes, and at small sizes it often is. 24.74% of accounts near 1,000 followers have a median post that reached more people than they have followers, so engagement can exceed the follower count without anything unusual happening. That share drops to 0.09% for accounts above a million followers, measured in the same window.
Does a high engagement rate mean the followers are real?
Not on its own. A timeline that is mostly retweets shows a median rate of 48.013% at 997 followers against 0.704% for comparable accounts that post their own material. That gap is not a property of the audience. Those accounts have a median of three original posts in the window, and the three carry view counts a 997 follower account does not produce. Count the original posts behind any rate, then compare against the band table, then audit the follower graph.
Which metric should I put in a listing when I sell an X account?
Publish the median engagement per original post, the follower count at the date you measured, and the median views per post. Those three let a buyer recompute both rates and locate the account in the tables above. A single percentage with no denominator, no date and no post type filter is not verifiable, and buyers who have read this far will discount it.
How often do these benchmarks change?
Scores are recomputed on a rolling 30 day window per account, and the scored population grew from 105,441 to 105,513 rows during the hours we spent querying it. Band medians move slowly. Composition moves faster, because the scanner keeps working down each follower tier, which is why a benchmark needs a date on it.
Related Articles
Continue learning with these related guides.
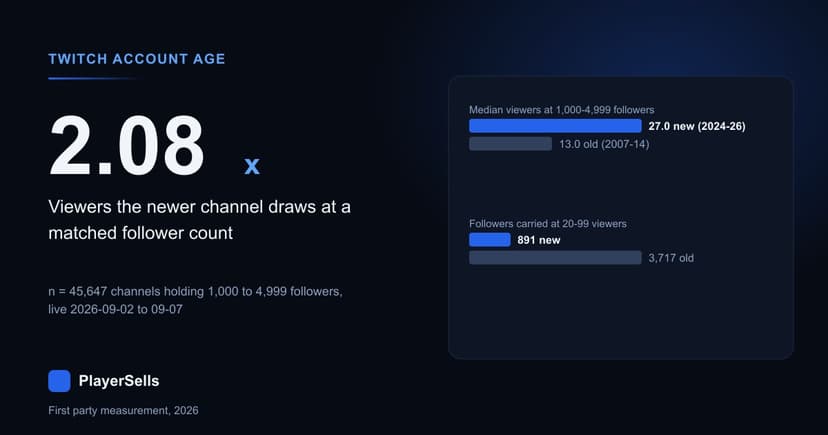
Does Twitch Account Age Still Matter? We Measured 432,192
Across 432,192 Twitch channels read on 2026-09-08, account age is almost pure accumulation, and at a matched follower count the newer channel wins.
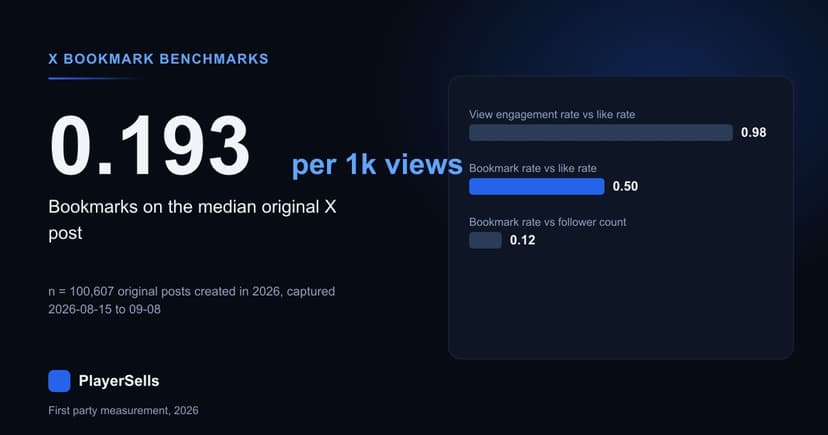
X Bookmark Rate Benchmarks From 94,318 Scored Accounts
Half the X accounts we scored on ten or more posts bookmark under 0.0273% of their views, and a third of original posts get no bookmarks at all.