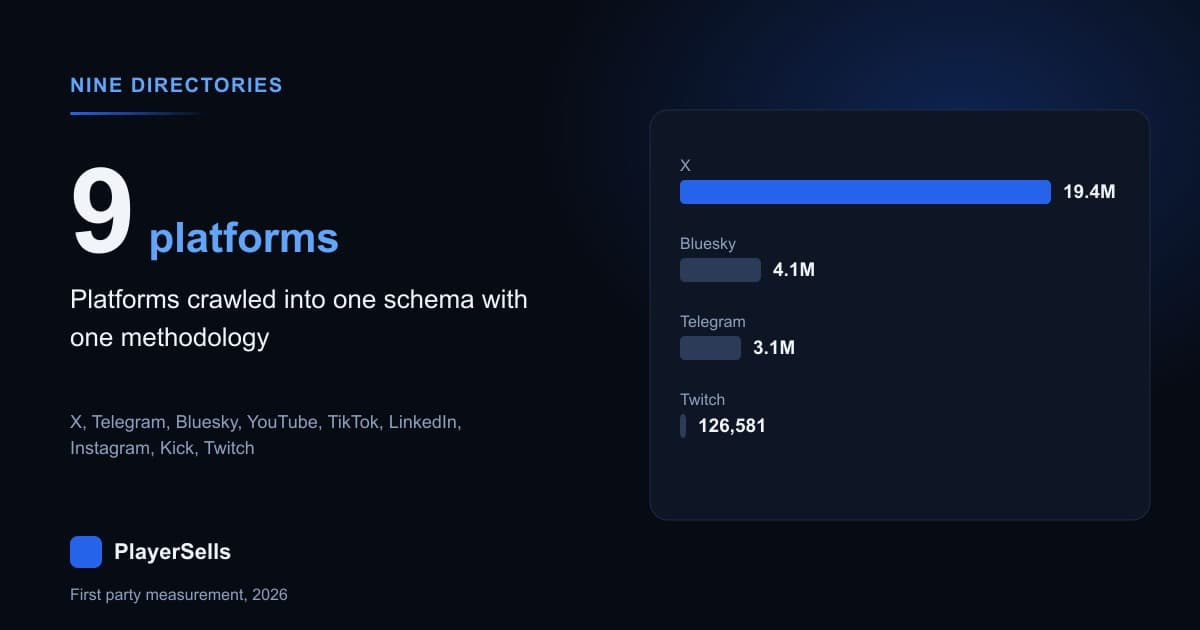
Across nine social platform directories that we run into one Postgres schema, the median audience ranges from 57 members on Telegram to 1,020,407 followers on Instagram, a spread of 17,900x measured over 26,985,041 profile records on 2026-09-02. That figure is not a fact about the platforms. It is a fact about how much of each platform we have crawled, and the same problem sits under every cross-platform social media comparison published anywhere in 2026.
We ran one light summary query per directory covering X, Telegram, Bluesky, YouTube, TikTok, LinkedIn, Instagram, Kick and Twitch. Nine crawlers, one schema, identical column types. Even so the nine are not comparable, because each platform exposes a different set of fields and each engine has run for a different length of time. The daily time series behind them spans 86 days for X and Telegram, 2 days for Kick and Twitch, and 0 days for LinkedIn, which has none at all.
So the honest answer to "how do these nine platforms compare" is that they do not, at least not on the axis most benchmark tables use. Directory record count and median audience rank-correlate at -0.67 across our nine directories. A real platform effect would not produce that sign. A crawl-breadth effect produces exactly that sign, and the rest of this article is the evidence.
What the nine directories actually hold
Each engine writes into a table with the same shape: one profile row per entity, one statistics row per entity per day, and edge tables where the platform exposes a graph. What differs is the unit counted. X, Bluesky, TikTok and Instagram hold accounts. Telegram holds chats, 94.8% of them broadcast channels in our sample of 94,113. LinkedIn holds companies, not people. Kick and Twitch hold streaming channels. Calling all nine "an audience" flattens four different objects into one column.
Three of the nine are too large to count exactly without holding a long transaction open on a live cluster, so their sizes below come from planner estimates rather than exact counts, and we label which is which. Our directory of X accounts is 1,435 times the size of our Instagram directory, and that single ratio decides most of what follows.
| Directory | Records on 2026-09-02 | Unit counted | Audience metric | Count method |
|---|---|---|---|---|
| X | 19,363,964 | account | followers | estimate |
| Bluesky | 4,131,487 | account | followers | estimate |
| Telegram | 3,106,628 | chat | members | estimate |
| Twitch | 126,584 | channel | followers | exact |
| 112,818 | company | page followers | exact | |
| Kick | 77,838 | channel | followers | exact |
| YouTube | 35,149 | channel | subscribers | exact |
| TikTok | 17,087 | account | followers | exact |
| 13,486 | account | followers | exact |
These directories are live while we query them. Our Twitch table held 126,584 channels when we built the row above and 127,852 about two hours later, a 1.0% drift inside a single session, while Kick moved from 77,838 to 78,168. Both engines began ingesting on 2026-09-01 and have not finished. A table like this is a photograph, not a constant, and every cell needs the timestamp it was taken at.
Why does the median audience range from 57 to 1,020,407?
Here are the distributions. For X, Bluesky and Telegram we used page-level TABLESAMPLE draws rather than full scans, with the sample size stated per row. For the other six we measured the full table. Every median covers only rows where the audience metric is populated and above zero. That matters most for Instagram, filled on 3,308 of 13,486 rows, and for Kick, where 27,561 of 77,838 channels carry no follower count at all. Those Kick gaps are not empty channels: 22,836 were actively streaming, so the Kick median rests on a non-random 59.5% of its directory and overstates the real figure.
| Directory | Rows measured | Median audience | P90 | Share at 10,000+ |
|---|---|---|---|---|
| 3,308 | 1,020,407 | 12,839,007 | 97.0% | |
| YouTube | 35,149 | 63,100 | 1,530,000 | 72.7% |
| TikTok | 16,987 | 8,432 | 984,211 | 48.1% |
| 103,136 | 7,443 | 108,214 | 44.5% | |
| X | 97,826 | 558 | 7,231 | 7.6% |
| Twitch | 125,070 | 252 | 8,292 | 9.1% |
| Bluesky | 78,457 | 132 | 1,193 | 1.0% |
| Kick | 46,492 | 101 | 4,004 | 4.9% |
| Telegram | 91,323 | 57 | 2,077 | 3.3% |
Sort that table two ways and the trap becomes visible. By record count the order runs X, Bluesky, Telegram, Twitch, LinkedIn, Kick, YouTube, TikTok, Instagram. By median audience the order is close to the reverse: Instagram, YouTube, TikTok, LinkedIn, X, Twitch, Bluesky, Kick, Telegram. The Spearman rank correlation between those two orderings is -0.67 across nine directories. Nine points is nine points, so read it as description rather than a significance test, but the direction is unambiguous.
Discovery method is the mechanism, not audience. Our X crawler walks the follow graph deep into the long tail, finds millions of small accounts, and the median falls to 558 followers. Our Instagram crawler was seeded from posts, which surfaces only accounts large enough to sample, so 97.0% of the 3,308 Instagram rows with a follower count sit above 10,000. Neither figure describes Instagram or X. Both describe a crawler.
Placing one account against a distribution built on a single consistent method is legitimate. Placing nine distributions built on nine different methods against each other is not. To locate one X account inside the sample this row came from, the X follower rank tool runs against that table directly, our X follower count benchmarks is the deep version of this row, and the X directory shows the long tail we actually crawl.
How long has each engine actually been measuring?
Every directory has a daily statistics table except LinkedIn, which has none at all. We measured the first and last day present in each of the eight tables that exist rather than assuming a shared window, and the results are not close to one another.
| Directory | First day | Last day | Span |
|---|---|---|---|
| X | 2026-06-09 | 2026-09-02 | 86 days |
| Telegram | 2026-06-09 | 2026-09-02 | 86 days |
| Bluesky | 2026-06-10 | 2026-09-02 | 85 days |
| YouTube | 2026-06-10 | 2026-09-02 | 85 days |
| TikTok | 2026-06-24 | 2026-09-02 | 71 days |
| 2026-08-29 | 2026-09-02 | 5 days | |
| Kick | 2026-09-01 | 2026-09-02 | 2 days |
| Twitch | 2026-09-01 | 2026-09-02 | 2 days |
| no table | no table | 0 days |
This is the column most published comparison tables omit, and it decides which claims are permitted. On X and Telegram we can discuss growth, decay and churn because we hold 86 consecutive days. On LinkedIn we can describe a company page as it stands and nothing more, because there is one state with no history behind it.
Why can a two-day window and an eighty-six-day window not share a table?
Our Kick and Twitch engines went live on 2026-09-01. Their daily statistics tables hold 2026-09-01 and 2026-09-02 and nothing else. A growth rate needs at least two clean observations of the same channel and realistically many more, so any Kick or Twitch trend, churn or growth figure would be arithmetic performed across a single interval that also contains the engine's own cold start. We do not publish those, and neither should anyone quoting a Kick growth rate measured this week.
Column names lie about their own windows too, which is the single trap most likely to poison a cross-platform table. Our Twitch and Kick tables carry fields named avg_ccv_30d, hours_streamed_30d and hours_watched_30d. We measured the real span of rows in both: 2026-09-01 12:57 UTC to 2026-09-02 15:28 UTC, or 26.5 hours. A name asserting 30 days is sitting on 26 hours of observation and overstates its own window by about 27x. Measure the window, never trust the column name.
What a two-day window does support is cross-sectional structure. Concurrent viewers, follower counts, category and language read on 2026-09-02 are all present and are genuine readings of the platform as it stood that day. So "the median Twitch channel in our directory of 126,584 channels has 252 followers" is publishable, while "Twitch channels grew by some percentage this month" is not, from this data, today. Anyone shopping for a channel should read our Kick channel buying page with that distinction in mind: the shape is measured, the trajectory is not yet.
Which fields does each platform actually expose?
Here is the asymmetry in its plainest form. We took six fields a buyer wants on any platform and measured what share of each directory has them populated. "No column" means the field does not exist in that platform's schema at all, which is a different and worse problem than a column that exists and is empty.
| Directory | Audience | Account age | Verified flag | Language | Geography | Engagement |
|---|---|---|---|---|---|---|
| X | 100% | 100% | 9.6% flagged | 71.9% | 36.3% | no column |
| Telegram | 97.0% | no column | 0.21% flagged | 67.2% | 0% | 80.9% |
| Bluesky | 100% | 99.9% | 0.22% flagged | 71.2% | 0% | 86.8% |
| YouTube | 100% | 100% | no column | 90.9% | 77.3% | 97.5% |
| TikTok | 99.4% | no column | 17.0% flagged | 99.9% | 0% | 98.3% |
| 91.4% | 70.9% | no column | no column | 82.2% | 79.1% | |
| 24.5% | no column | 77.8% flagged | 21.1% | no column | 24.5% | |
| Kick | 59.5% | no column | 11.9% flagged | 98.7% | no column | 83.0% |
| Twitch | 98.4% | 99.99% | no column | 99.99% | no column | 84.5% |
Not one of those six fields is present and populated above 50% on all nine platforms. Audience size comes closest and still fails on Instagram at 24.5%. A real account creation timestamp exists on four of the nine. Geography clears 50% on two. LinkedIn's 70.9% under account age is a company founding year, which is a different fact wearing the same shape. That is the measured state of cross-platform social data, and it is why any benchmark that fills every cell of a nine-by-six grid has invented most of them.
YouTube adds a subtler limit. Of the 32,448 channels in our YouTube directory holding at least 1,000 subscribers, 26,231 carry a subscriber count that is an exact multiple of 100, and all 4,897 channels above one million are exact multiples of 10,000. YouTube rounds what it publishes, so an exact subscriber count is not measurable there at any commercially relevant size. Only 28 of our 3,308 Instagram follower counts are multiples of 100. Read a YouTube subscriber rank against that rounding, and price with our YouTube channel buying guide beside it.
What does verified mean on each platform?
Six of the nine directories carry a verification flag, and those six flags describe six different products. Instagram's flag sits on 77.8% of our 13,486 Instagram rows, which says nothing about Instagram and everything about a directory seeded from posts by large accounts. The legacy X verification column is dead in our data at 0 of 57,617 sampled rows, because X removed the old blue check, so the live flag is the paid subscription one at 9.6%.
| Directory | Flag we hold | Share flagged | What it actually means |
|---|---|---|---|
| verified | 77.8% of 13,486 | seeded sample skew, not a platform rate | |
| TikTok | verified | 17.0% of 17,087 | platform-granted verification |
| Kick | verified | 11.9% of 77,838 | platform-granted verification |
| Twitch | no flag | partner 10.4% | a monetisation tier, not identity |
| X | blue verified | 9.6% of 97,827 | a paid subscription |
| Bluesky | verified | 0.22% of 78,457 | rarely granted |
| Telegram | verified | 0.21% of 94,113 | rarely granted |
| YouTube | no flag | not measurable | no verification column exists |
| no flag | not measurable | no verification column exists |
Ranking those percentages would produce a league table of nothing. A paid X subscription at 9.6% and a Telegram verification at 0.21% are not the same object, and the 370x gap between Instagram's 77.8% and Telegram's 0.21% is mostly sampling. What a badge is worth to a buyer varies by platform for reasons unconnected to these shares, which we measured separately in what verification is actually worth when you buy an account.
Which platforms let you check an account's age or country?
Account age is the field buyers ask for most often and the field that goes missing most often. We hold a real creation timestamp on X at 100%, YouTube at 100%, Twitch at 99.99% and Bluesky at 99.94% of sampled rows. Telegram, TikTok, Instagram and Kick carry no creation date column at all in their schema, so an age check on those four platforms has to come from evidence outside the directory entirely.
Geography is in worse condition, and checking it corrected our own documentation. Our internal notes listed the X country column as effectively empty. Two independent samples say otherwise: 35,548 of 97,827 rows in one draw and 14,192 of 38,965 in a second, both landing between 36.3% and 36.4% populated, with US, GB, BR, IN and ES as the leading values. That is a minority of rows and useless as a census, but it is not a dead column, and we amended the note.
Three other geography claims did not survive the data. Telegram and Bluesky country columns are populated on 0% of our samples. TikTok's region is populated on 0 of 17,087 rows, a dead column our notes had never flagged. Kick has no country, state, city or region column anywhere in its schema, so Kick geography is not empty, it is absent. LinkedIn holds two geography fields where one works: hq_country at 1.3% and country_code at 82.2%, so the wrong choice would have produced a 63x error in one cell.
How much of each directory did we refresh in one day?
Directory size records how many profiles we have ever seen. It says nothing about how many are current. We counted the rows written into each daily statistics table for 2026-09-02 and divided by directory size, which yields the share of each directory that received a fresh measurement on that one day.
| Directory | Profiles refreshed on 2026-09-02 | Share of directory |
|---|---|---|
| Kick | 54,205 | 69.6% |
| Twitch | 73,857 | 58.3% |
| YouTube | 11,497 | 32.7% |
| TikTok | 4,173 | 24.4% |
| Telegram | 68,026 | 2.19% |
| Bluesky | 23,109 | 0.56% |
| 12 | 0.09% | |
| X | 7,937 | 0.041% |
| 0 | 0% |
The gap between Kick at 69.6% and X at 0.041% is roughly 1,700x, driven entirely by crawler capacity and API cost rather than by anything the platforms do. A 77,838 row directory can be refreshed almost completely each day. A 19.4 million row directory cannot. So "as of today" means a different thing in every row, and a benchmark presenting all nine as current is wrong about eight. Our Telegram channel rank tool and the Twitch channel directory each carry their own freshness.
What we rejected while building this table
Four numbers were killed before publication. Any Kick or Twitch growth, churn or trend figure went first, because a 2 day window cannot support one. A verified-share league table went second, because Instagram's 77.8% is our seeding method rather than a platform rate. A median-audience-by-platform chart presented as a platform fact went third, for the reason the -0.67 rank correlation gives. The mean was rejected everywhere in favour of the median, because all nine distributions are heavy tailed and every mean would have overstated the typical account.
Six columns were tested and dropped as dead: the legacy X verification flag at 0 of 57,617 sampled rows, YouTube's hidden subscriber flag at 0 of 35,149, TikTok's region at 0 of 17,087, and three Instagram fields, where status holds one value across all 13,486 rows while is_nsfw is true on 1 row and is_private on 6. One column came back from the dead: Telegram's stored engagement rate, described in our own notes as structurally empty, is populated on 4,733 of 31,108 sampled rows. At 15.2% it is still too thin to publish, so we compute Telegram engagement ourselves as average views divided by member count.
How should a buyer read a cross-platform benchmark?
Use within-platform percentiles and never cross-platform medians. A percentile computed on one directory with one method fairly states where an account sits inside that crawl, and stays fair over time as long as the method holds steady. The same percentile from another platform's directory is a different instrument reading a different population, and the two do not divide into each other however neatly they line up.
Ask four questions of any comparison table, this one included. What is the sample and how was it discovered. How long is the measurement window. Which cells are measured and which are absent. And does the discovery path run through the platform being measured, because a claim about LinkedIn drawn from a universe found through LinkedIn is circular by construction. A table that cannot answer all four is a shape, not a measurement. Which is why a real listing beats a benchmark: browse live account listings and you see one account with one verifiable history.
Common questions about comparing social platform statistics
These are the questions buyers and sellers send us most often about cross-platform numbers, answered from the same 2026-09-02 measurement described above. Each answer names the sample it comes from, because a figure without a denominator is the exact failure mode this article was written to document. Where we cannot measure something, the answer says so.
Why do social platform comparison statistics disagree so much between sources?
Because each source samples a different population. Our own nine directories, built by one team into one schema, still produce medians ranging from 57 to 1,020,407, and the rank correlation between directory size and median audience is -0.67. If nine crawlers under one roof disagree that much, published tables stitched from separate vendor surveys with separate definitions will disagree more, and usually without saying so.
Is the median Instagram account really over one million followers?
No. The median is 1,020,407 followers across the 3,308 rows in our Instagram directory that carry a follower count, which is 24.5% of the 13,486 rows we hold. That subset was seeded from posts, so it is biased toward large accounts by construction. The number is a correct description of our sample and a wrong description of Instagram.
Can you compare a Twitch channel to a YouTube channel by follower count?
Not directly. Our Twitch directory of 126,584 channels has a median of 252 followers while our YouTube directory of 35,149 channels has a median of 63,100 subscribers, and that 250x gap is mostly the difference between crawling a full streaming directory and crawling an established channel set. A Twitch follower and a YouTube subscriber also cost different amounts of viewer intent to acquire.
Which platforms let you verify an account's age before buying?
Four of the nine we measure. X, YouTube, Twitch and Bluesky expose a creation timestamp populated on 99.9% or more of rows. Telegram, TikTok, Instagram and Kick have no creation date column at all, so age on those platforms has to be established from post history, archived pages or seller evidence rather than a field. LinkedIn exposes a company founding year, which is not the same thing.
Why do you refuse to publish Kick and Twitch growth rates?
Because both engines started on 2026-09-01 and their daily statistics tables hold exactly two days, 2026-09-01 and 2026-09-02. A growth rate over one interval that includes an engine's cold start measures our crawler, not the platform. Cross-sectional figures from those two days, such as concurrent viewers and follower counts, are real and we do publish those.
What is the most comparable metric across platforms?
Percentile position inside a single platform's own directory, measured with a stated window. It survives the asymmetries documented here because it never crosses instruments. Absolute counts do not survive, verification shares do not survive, and geography survives on two of our nine platforms. If a table hands you nine raw medians side by side, treat the layout as decoration.
Related Articles
Continue learning with these related guides.
Does Twitch Account Age Still Matter? We Measured 432,192
Across 432,192 Twitch channels read on 2026-09-08, account age is almost pure accumulation, and at a matched follower count the newer channel wins.
X Bookmark Rate Benchmarks From 94,318 Scored Accounts
Half the X accounts we scored on ten or more posts bookmark under 0.0273% of their views, and a third of original posts get no bookmarks at all.