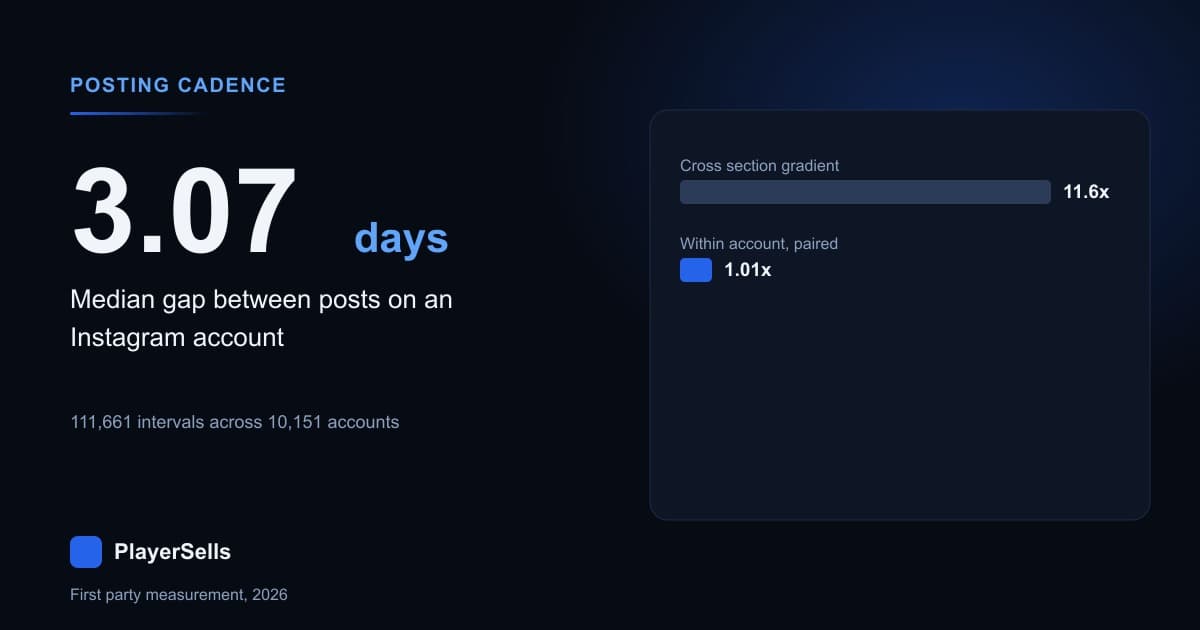
The median Instagram account in our directory publishes once every 3.07 days, which works out to about 2.3 posts per week. We measured that on 10,151 accounts and 111,661 consecutive post-to-post intervals, drawn from an Instagram directory of 173,209 posts across 13,417 accounts that we crawled between 2026-08-29 and 2026-09-02. The middle half of accounts sits between one post every 1.08 days and one every 8.18 days. Roughly daily to roughly weekly is where normal Instagram lives in 2026.
The second result matters more if money is involved. Posting more often does not measurably cost you likes. The raw cross-section says it does, by 11.6x: accounts with a median gap under 12 hours carry 1,499 median likes per post, while accounts posting every 8 to 31 days carry 17,360. Compare each account against itself and that gap collapses. Among accounts whose captured posts span 60 days or less, a post published within six hours of the previous one scored 1.00 of its own account's median like count, against 1.01 for a post published three to seven days later.
What does the full posting cadence ladder look like?
For each account we computed the median gap between consecutive posts, then took percentiles of that per-account figure. Working from per-account medians rather than pooled intervals stops a handful of hyperactive accounts from setting the number for everyone. The two formulations agree anyway: the pooled median across all 111,661 intervals is 3.028 days against 3.070 days for the median of per-account medians, a difference of 1.4%.
This ladder places an account against the 10,151 accounts in our measurement stratum. Read it as gap first and cadence second, because the gap is the quantity we measured and the posts-per-week column is only a conversion of it. A position at the fast end of the ladder means a shorter wait between posts, not a higher rank on anything Instagram cares about.
| Position in sample | Median gap between posts | Equivalent posts per week |
|---|---|---|
| Fastest 10% | 0.42 days | 16.7 |
| Fastest 25% | 1.08 days | 6.5 |
| Median account | 3.07 days | 2.3 |
| Slowest 25% | 8.18 days | 0.86 |
| Slowest 10% | 20.05 days | 0.35 |
| Slowest 1% | 78.34 days | 0.09 |
Grouped differently, 20.0% of accounts post more than once a day on median, 50.9% sit between daily and weekly, 22.9% between weekly and monthly, and 6.2% leave more than 30 days between posts. Daily posting, the target most Instagram guidance converges on, would place an account just inside the fastest quarter of real accounts rather than in the middle of them.
Why most posts-per-week numbers measure the crawler, not the account
Here is the trap that would have wrecked this article. Our Instagram crawler captures a bounded slice of each account's recent posts, and that slice is a fixed count, not a fixed period. Of 13,417 accounts, 10,151 have exactly 12 captured posts. The 10th percentile of posts per account is 12, the median is 12, and the 75th percentile is 12. Any sentence of the form "the average account in our data has 12 posts" is a sentence about our crawler.
The fixed-count design has a useful consequence. Because the count is held constant, the observed time span varies, and that span is the measurement. Across accounts the observed window runs from 11.0 days at the 10th percentile to 117.5 days at the median and 894.2 days at the 90th percentile, with a maximum of 4,875.7 days. A slow poster shows a long window because it posts slowly, not because we watched it for longer.
The obvious correction, keeping only accounts observed over a long enough period, is the wrong one here. Filtering on a long window deletes fast posters; filtering on a short one deletes slow posters. We conditioned on the fixed-count stratum instead, then tested whether capture depth changes the answer. It does not.
| Window used | Accounts | Median gap between posts |
|---|---|---|
| Three most recent posts | 10,151 | 3.53 days |
| Six most recent posts | 10,151 | 2.98 days |
| All twelve captured posts | 10,151 | 3.07 days |
A fixed-time cut behaves worse, which is the point. Counting posts in the 30 days before each account's crawl gives a median of 6 and a 75th percentile of 10, but 18.7% of accounts hit our 12-post capture ceiling inside that window. The median survives because it sits below the ceiling. A mean would not, and neither would any claim about the top of the distribution.
Is Instagram posting steady, or is it bursty?
Bursty, by a wide margin. The median account's median gap is 3.07 days, but its mean gap is 10.7 days. That ratio of roughly 3.5x is the signature of clustered posting broken by long silences: a run of posts over a few days, then a stretch of nothing.
Same-day activity confirms it. Across 104,601 account-days on which at least one post appeared, 10.0% carried two or more posts, and those days account for 22.7% of all 121,812 posts in the stratum. The busiest single account-day held 12 posts. Modelling an Instagram account as a metronome producing one post every N days describes something that does not exist.
This matters to a buyer reading a listing. A seller who claims daily posting may be describing a real weekly average built from two posting days and five silent ones. The distribution of gaps inside the account is the honest number, and it is visible in the public post history before you pay. Our Instagram engagement calculator works on the same post-level basis.
Does posting more often dilute engagement on Instagram?
Measured across accounts it looks like it does, dramatically. We sorted the 10,151 accounts into cadence bands by their median gap and took the median of each account's median like count. The spread is 11.6x from fastest to slowest, and it runs the wrong way for anyone who posts a lot.
| Median gap between posts | Accounts | Median likes per post | Median comments per post | Posted in the 7 days before our crawl |
|---|---|---|---|---|
| Under 12 hours | 1,077 | 1,499 | 23 | 90.2% |
| 12 to 25 hours | 1,386 | 1,656 | 27 | 91.0% |
| 1 to 3.5 days | 2,863 | 4,153 | 58 | 78.4% |
| 3.5 to 8 days | 2,205 | 11,991 | 123 | 55.5% |
| 8 to 31 days | 2,017 | 17,360 | 169 | 31.9% |
| Over 31 days | 603 | 12,963 | 133 | 17.6% |
The pattern survives two obvious controls. Restricting to accounts whose twelve captured posts all fall in 2026 keeps it: 1,600 median likes for accounts with a gap under 12 hours against 24,084 for accounts slower than one post every 8 days, on 6,267 accounts. And on the 2,559 accounts where our directory also holds a follower count, median followers move within a 2.8x range across bands, from 513,137 to 1,413,625, while median likes move 9.3x, from 2,506 to 23,278.
That follower comparison is a control, not a benchmark. Our Instagram account table carries a follower count on only 3,308 of 13,486 rows, and the rows it carries skew heavily towards large accounts. Read at face value, though, the band table writes its own advice: post less, earn more. That conclusion is wrong, and the next section is why.
What happens when you compare an account against itself?
The between-account comparison asks whether accounts that post often differ from accounts that post rarely. They plainly do. It does not ask whether an account that posts more gets less per post, which is the question an owner or a buyer actually has. For that we ran a paired test inside each account.
For every post we computed the gap since that account's previous post, and the post's like count divided by that account's own median like count. Because the reference is the account's own median, size, niche, audience quality and follower count all cancel out. We report the geometric mean of that ratio indexed against the baseline for the same set of posts, so 1.00 reads as exactly typical for that account. The first version uses all 111,608 usable transitions.
| Gap since previous post | Transitions | Index against the account's own baseline |
|---|---|---|
| Under 6 hours | 14,423 | 0.97 |
| 6 to 24 hours | 15,767 | 0.94 |
| 1 to 3 days | 24,758 | 0.93 |
| 3 to 7 days | 18,910 | 0.96 |
| 7 to 30 days | 21,740 | 1.03 |
| Over 30 days | 16,021 | 1.26 |
Even unrestricted, the largest penalty for fast posting is 7%, at the one to three day gap, which is already a long way from 11.6x. The 26% premium on posts that follow a break of more than 30 days is not trustworthy, because those posts sit early in each account's sequence, at a median position of 4 out of 12, so they are older posts from a period when the account was usually smaller. To remove that drift we repeated the test on accounts whose twelve posts span 60 days or less.
| Gap since previous post | Transitions | Index, follower drift controlled |
|---|---|---|
| Under 6 hours | 8,746 | 1.00 |
| 6 to 24 hours | 8,726 | 0.99 |
| 1 to 3 days | 11,879 | 0.99 |
| 3 to 7 days | 6,124 | 1.01 |
| 7 days or more | 2,516 | 1.08 |
In that version the dilution effect is gone. Across 37,991 transitions the worst any short gap does is 0.99 of the account's own baseline, a penalty of about one percent. The only visible lift is 1.08 for a gap of seven days or more, on 2,516 transitions, and part of that is the same comeback effect.
So the 11.6x gradient across accounts is composition, not causation. High-cadence accounts in our directory are a different kind of account, with audiences that engage less per post; their cadence is a marker of what they are, not a lever that lowered their likes. An earlier measurement of ours found heavier posting associated with weaker per-post engagement on TikTok. On Instagram that association does not survive a within-account test. The platform-level TikTok picture sits in our TikTok growth benchmarks across 179,404 daily snapshots.
When do Instagram accounts actually post?
All timestamps in our post table are stored in UTC and the accounts are global, so a UTC hour distribution mixes many local clocks. With that stated, the aggregate is sharply peaked. Of the 121,812 posts in our stratum, 25.2% land in the three hours from 15:00 to 17:59 UTC, and 60.6% land in the nine hours from 12:00 to 20:59 UTC. The busiest single UTC hour is 16:00 with 11,299 posts; the quietest is 05:00 with 1,630, a spread of 6.9x.
| UTC block | Posts | Share of 121,812 |
|---|---|---|
| 00:00 to 02:59 | 8,217 | 6.7% |
| 03:00 to 05:59 | 5,621 | 4.6% |
| 06:00 to 08:59 | 7,364 | 6.0% |
| 09:00 to 11:59 | 12,447 | 10.2% |
| 12:00 to 14:59 | 20,143 | 16.5% |
| 15:00 to 17:59 | 30,705 | 25.2% |
| 18:00 to 20:59 | 23,013 | 18.9% |
| 21:00 to 23:59 | 14,302 | 11.7% |
We checked that this is posting behaviour and not capture behaviour. Our crawl ran from 2026-08-29 to 2026-09-02, so each account's newest post is truncated at the moment we reached it. Dropping every account's newest post leaves the same shape, 10,338 posts at 16:00 against 1,509 at 05:00. Restricting to accounts whose observed window covers 28 days or more leaves it too, 9,145 against 1,372. The peak belongs to the accounts, not to our cron.
Is there a single best hour to post on Instagram?
No, and our own data shows why. Our account table carries a declared language on 2,844 rows, which is thin but enough to expose the mixing. The modal UTC posting hour moves with language in exactly the way local clocks predict.
| Account language | Posts measured | Modal posting hour, UTC | Local equivalent |
|---|---|---|---|
| English | 17,148 | 16:00 | many timezones |
| Turkish | 2,292 | 16:00 | 19:00 |
| Korean | 1,692 | 09:00 | 18:00 |
| Spanish | 624 | 17:00 | many timezones |
| Japanese | 600 | 08:00 | 17:00 |
| Portuguese | 456 | 19:00 | many timezones |
| German | 396 | 15:00 | 17:00 |
| Russian | 396 | 11:00 | 14:00 |
Every single-timezone cluster we can resolve peaks between 14:00 and 19:00 local. Korean accounts peak nine hours before English accounts on the UTC clock and at nearly the same hour on their own. A published best time to post on Instagram, stated in one timezone, is really a statement about which audience the publisher happened to measure. The workable version is local and account-specific, which is how our best posting time tool frames it, and it is the same reasoning behind our measurement of the best time to post on X.
Which weekday carries the most Instagram posts?
Friday, and Sunday is the floor. Across the 121,812 posts in our stratum, Friday carries 16.8% and Sunday 11.9%, a spread of 1.41x. Volume climbs steadily from Monday through Friday, then drops across the weekend. Whether that reflects when audiences are available or simply when the people running these accounts are at their desks is not something posting timestamps can settle.
| Day | Posts | Share of all posts | Share among accounts observed 180 days or more |
|---|---|---|---|
| Monday | 16,982 | 13.9% | 14.2% |
| Tuesday | 16,864 | 13.8% | 14.4% |
| Wednesday | 18,081 | 14.8% | 15.0% |
| Thursday | 19,041 | 15.6% | 15.5% |
| Friday | 20,467 | 16.8% | 16.0% |
| Saturday | 15,906 | 13.1% | 12.2% |
| Sunday | 14,471 | 11.9% | 12.7% |
The right-hand column is the artifact check. An account whose entire observed window is eight days contributes roughly one week of weekdays, and if many such accounts were crawled on the same date, our crawl date could imprint a weekday pattern that belongs to us. Restricting to the 50,988 posts from accounts observed for 180 days or more, where every account spans many weeks, keeps Friday on top and the weekend at the bottom. The pattern is theirs.
Does the hour you choose change how the post performs?
Slightly, in the opposite direction to the crowd, and partly for reasons that have nothing to do with timing. Using the same within-account index, the busiest UTC hours perform at or just below each account's own baseline: 17:00 indexes at 0.95 on 9,801 posts and 16:00 at 0.97 on 11,292. The emptiest hours run higher, with 03:00 at 1.19 on 2,027 posts. Best against worst is 1.25x.
Because a UTC hour is not a local hour, we ran a timezone-free version. For each account we identified its own most-used posting hour, then measured performance as a function of distance from that hour. Posts inside the account's habitual hour index at 0.96 across 36,562 posts. Posts published ten or more hours away from it index at 1.14 across 7,161 posts.
Then we tried to kill it. We re-ran the identical design on a variable that cannot matter: each account's modal minute of the hour. That placebo produced a same-versus-far spread of 3.6%, against 18.7% for the real hour variable, so roughly a fifth of the raw effect is mechanical, because the crowded bucket helps define the median it is measured against. Adjusted for the placebo, a post published far from an account's routine runs about 14% above that account's own median.
We are not turning that into advice. Off-schedule posts are self-selected. People break a routine for launches, news and results, which are exactly the posts that would have outperformed at any hour. The measurement supports one modest claim: choosing a clock hour is worth single-digit percentages, the cadence question is worth close to nothing, and both are dwarfed by what the account is and what it posts.
What does this mean for buying or selling an Instagram account?
Cadence is a liveness signal, not a performance lever. The strongest thing it predicts in our data is whether the account is still working at all. Among accounts with a median gap under 12 hours, 90.2% had posted in the seven days before we crawled them. Among accounts slower than one post every 31 days, 17.6% had. Cadence tells you whether you are buying a working asset or an archive.
At directory level, 68.4% of our 13,417 Instagram accounts had posted within seven days of our crawl, 86.1% within 30 days and 94.4% within 90 days, with only 1.5% silent for more than a year. Median time since the last post was 2.6 days. Judge a listing against those base rates rather than against the seller's description. What is currently for sale sits on our live marketplace, and buyers shopping for this platform specifically should start from the Instagram account listings.
Three rules follow from the measurement. First, do not pay a premium for a high posting rate, because within an account it buys no extra engagement per post. Second, do not accept the reverse story either, because the 11.6x cross-sectional gradient is about account type rather than about schedule. Third, price the audience, not the calendar. On the selling side, listing an account with an honest gap distribution and a recent post history beats a cadence claim with no evidence behind it. Our Instagram earnings calculator and the accounts ranked in our Instagram directory both work from measured activity rather than from self-reported schedules.
What we could not measure
Three limits are worth stating plainly. Our post table holds no impressions, reach or saves. It holds likes, comments, and views on video formats only, so every performance figure here is a like-based index, and view counts are useless as a cross-format timing metric.
Second, our account table is thin. It holds 13,486 rows but a follower count on only 3,308 and a declared language on 2,844, so anything requiring follower normalisation runs on roughly a quarter of the sample and skews large. The precomputed posts_analyzed column on that table simply mirrors our capture depth, so we did not use it as a measure of how much an account posts.
Third, this is a five-day crawl of a fixed slice of history, not a panel. We can measure the intervals inside each account's most recent twelve posts and when those posts were published, but we cannot watch an account change its cadence and observe what followed. Every relationship reported here is an association measured across posts, not an experiment.
Questions about Instagram posting frequency
The queries behind this article ran against our own Instagram directory on 2026-09-02, over 173,209 posts from 13,417 accounts captured between 2026-08-29 and 2026-09-02. Every figure below carries the sample it came from, and each is a first-party measurement of post timestamps rather than a survey of what account owners say they do.
How often should you post on Instagram in 2026?
Our measurement gives a benchmark, not a prescription. The median account in our directory posts once every 3.07 days, and the middle half sits between every 1.08 and every 8.18 days, measured on 10,151 accounts. Daily posting puts you just inside the fastest quarter. Because per-post performance inside an account barely moves with cadence, the practical answer is to pick a rate you can sustain: the cost of posting more is close to zero, and the cost of stopping is visible in the data.
Does posting too much on Instagram hurt engagement?
Not in our data. Comparing each account against itself across 37,991 post-to-post intervals from accounts observed over 60 days or less, a post published within six hours of the previous one scored 1.00 of that account's own median like count, and six to 24 hours scored 0.99. The 11.6x gap between fast and slow posters across accounts is a difference between kinds of account, not a penalty applied to any one of them.
What is the best time to post on Instagram?
There is no single global hour. Posting volume peaks at 16:00 UTC across our 121,812-post sample, but the modal hour moves with account language: 09:00 UTC for Korean accounts, 08:00 for Japanese, 16:00 for English. Converted to local time, every cluster we can resolve peaks between 14:00 and 19:00. Measure your own audience rather than adopting somebody else's timezone.
Which day of the week do most Instagram accounts post?
Friday, with 16.8% of the 121,812 posts we measured, against 11.9% on Sunday, a spread of 1.41x. The pattern holds when we restrict to the 50,988 posts from accounts observed for 180 days or more, so it is not an artifact of our crawl date. Friday is also the weakest day relative to each account's own baseline, indexing at 0.95, which is consistent with crowding rather than with an audience effect.
Is a high posting rate worth paying more for when you buy an account?
No, on this evidence. Within-account cadence effects on likes sit inside one to two percent. What cadence does predict is liveness: 90.2% of accounts with a median gap under 12 hours had posted in the week before our crawl, against 17.6% of accounts slower than 31 days. Treat a high rate as evidence the account is being worked, then price the audience it actually reaches.
How bursty is normal Instagram posting?
Very. The median account's median gap is 3.07 days while its mean gap is 10.7 days, a ratio of about 3.5x, and 22.7% of the 121,812 posts we measured landed on a day when that account posted at least twice. Ten percent of the 104,601 active account-days in our sample carried two or more posts. Treating an account as posting evenly every N days misrepresents almost every account we looked at.
Related Articles
Continue learning with these related guides.
Does Twitch Account Age Still Matter? We Measured 432,192
Across 432,192 Twitch channels read on 2026-09-08, account age is almost pure accumulation, and at a matched follower count the newer channel wins.
X Bookmark Rate Benchmarks From 94,318 Scored Accounts
Half the X accounts we scored on ten or more posts bookmark under 0.0273% of their views, and a third of original posts get no bookmarks at all.