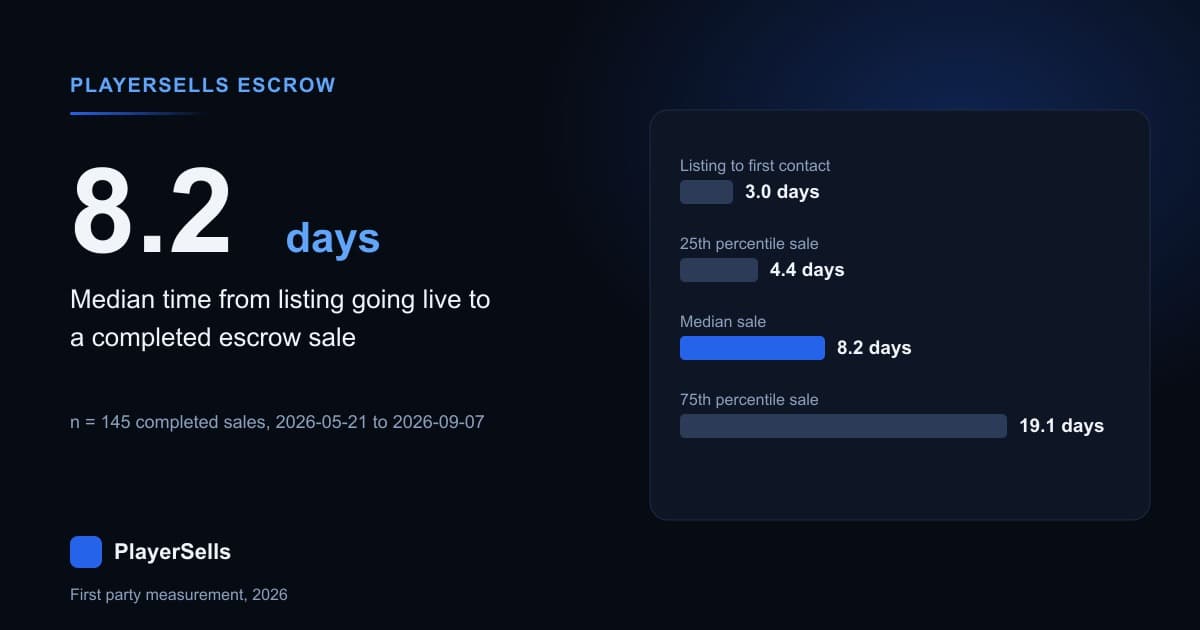
Half the account listings that sold on PlayerSells sold within 8.2 days of going live. We measured that across 145 listings whose escrow deal reached completed status between 2026-05-21 and 2026-09-07, drawn from the 798 listings created on the marketplace since 2026-03-16. The middle half took between 4.4 and 19.1 days. 6.2 percent cleared inside 24 hours and 3.4 percent took more than 60 days. That is our own 2026 transaction ledger for X, TikTok and Telegram account sales, not a survey and not an industry estimate, and 145 is a small number that this article will keep saying out loud.
The harder half of the question is what never sells. Of the 436 listings that were active at 13:08 UTC on 2026-09-08, 300 have never received a single priced offer, and the active book has a median age of 25.4 days. Among the 471 listings created more than 30 days ago, 34.4 percent of those asking under $50 have cleared against 4.6 percent of those asking $400 or more. Time to sale is a survivor statistic. Clearance rate is the number that decides whether you ever get one.
Why we excluded 70 rows from our own sales ledger
The deals table holds 1,212 rows. Seventy of them are not sales. They carry a signature no organic transaction has: exactly ten deals at each of seven fixed prices, cycled across only 23 listings, both sides of every one an internal platform account, and a null credentials payload on all 70, meaning no login was ever handed over. They are internal records, not transactions, and every figure below excludes them.
Removing them changes the shape of everything. Completed deals fall from 215 to 145, a 48 percent difference. The real deal history starts on 2026-04-04 rather than the 2025-12-10 the raw minimum reports, because those 70 rows are dated earlier than any genuine deal. And the ledger goes from 215 completed deals across 154 listings to 145 across 145, one sale per listing, which is the shape a real transaction record has.
The listing status flag does not agree with the deal ledger either. There are 157 listings flagged sold, but only 122 have a completed escrow deal behind them, while another 23 listings with a completed deal carry an archived or suspended status instead. Every number here counts the deal ledger, because money moving is a fact and a status flag is an edit.
What does the full time to sale curve look like?
Measured from the moment a listing is created to the moment its escrow deal completes, across all 145 clean sales, the distribution is right skewed in the way you would expect from a thin market. The tenth percentile is 1.4 days and the ninetieth is 33.6 days. The mean is 14.5 days, which is 77 percent above the median, so anybody quoting a mean here is quoting the tail.
This table buckets all 145 sales by how long the listing sat before its escrow completed. It is the whole population of completed sales in the window, not a sample.
| Time from listing to completed escrow | Listings | Share of the 145 |
|---|---|---|
| Under 24 hours | 9 | 6.2% |
| 1 to 3 days | 20 | 13.8% |
| 3 to 7 days | 33 | 22.8% |
| 7 to 14 days | 36 | 24.8% |
| 14 to 30 days | 26 | 17.9% |
| 30 to 60 days | 16 | 11.0% |
| 60 days or more | 5 | 3.4% |
Splitting by platform is where the small n bites. X listings, still stored under the platform name Twitter in our own listings table, make up 136 of the 145 sales, with a median of 8.2 days and quartiles of 4.8 and 18.6 days. Telegram and TikTok contribute 9 sales between them, too few to publish a distribution for either, so we are not printing one. For the cross platform price picture rather than the speed picture, our breakdown of what social accounts actually sell for by platform uses a wider base.
How fast does the first offer arrive?
Faster than the sale, and the gap between the two is the whole negotiation. Across those same 145 listings, the median time from listing creation to the first deal thread of any kind is 3.0 days, with quartiles at 1.0 and 7.3 days. So the median seller waits three days for someone to make contact and about five more for the money to clear.
Inside a deal the clock runs very differently. Of the 220 deals that ever had funds held in escrow, the median gap from the deal opening to the escrow hold landing is 0.28 hours, roughly 17 minutes, with a seventy fifth percentile of 3.7 hours. A buyer who is going to pay pays almost immediately. From the escrow hold to completion the median is 19.6 hours across the 145 completed deals, with a ninetieth percentile of 101.7 hours.
Read those three intervals together and the slow part of selling an account is not the transfer and not the escrow. It is waiting for a buyer to show up. The mechanics of the middle step are covered in how account escrow protects both sides, and the fees that apply to it are on the PlayerSells fee and boost pricing page.
What is sitting unsold right now?
436 listings were active when we ran this on 2026-09-08. Their median age is 25.4 days, the seventy fifth percentile is 51.9 days and the ninetieth is 69.7 days. Eighteen percent of the active book, 79 listings, is older than 60 days.
Age alone understates the problem, because a listing can be old and still in play. The sharper cut is contact. Of the 436 active listings, 300 have never received a priced offer and 256 have never received any message thread at all. Restrict to the 201 active listings older than 30 days and it barely improves: 112 of them, 55.7 percent, have never had a priced offer.
| Priced offers received | Active listings | Share of the 436 |
|---|---|---|
| None | 300 | 68.8% |
| One | 91 | 20.9% |
| Two | 21 | 4.8% |
| Three or four | 18 | 4.1% |
| Five or more | 6 | 1.4% |
The sold side is oddly thin in the same way. Across the 145 listings that cleared, the median number of priced offers received was one and the mean was 1.68. A listing that sells usually sells to the first serious buyer who turns up. There is no bidding war in this data because in most cases there is nobody to bid against, which is also why auctions are absent here: the live marketplace held exactly three auction rows on the day of measurement, with zero bids between them.
Does the asking price decide whether a listing sells at all?
It decides more than anything else we measured. Taking every listing created more than 30 days before 2026-09-08, so that each one has had at least a month of exposure, clearance falls hard as the ask rises.
| Asking price band | Listings 30 days or older | Cleared | Clearance rate |
|---|---|---|---|
| Under $50 | 154 | 53 | 34.4% |
| $50 to $150 | 131 | 41 | 31.3% |
| $150 to $400 | 77 | 17 | 22.1% |
| $400 and up | 109 | 5 | 4.6% |
A listing asking under $50 is 7.5 times more likely to have cleared than one asking $400 or more. The obvious objection is that cheap listings might just be a different platform, so we ran the same cut on X listings alone, where n is 376: 37.8, 37.4, 29.3 and 6.0 percent across the same four bands. It is not a platform artefact. A second formulation agrees: among X listings older than 30 days, the median ask was $70 on those that cleared against $125 on those that did not.
Two honest limits. This is an association between the price a seller chose and whether a sale happened, not proof that cutting a price causes one, because no account here was listed twice at two prices. Expensive accounts also have genuinely rarer buyers. What the data rules out is the comfortable story that a high ask eventually finds its buyer: in this book it mostly does not, and the deviation shows up as unsold inventory rather than as heavy discounting. Our note on how to price an X account before selling it covers the inputs.
Which follower band actually clears?
Not the biggest one. Restricting to the 376 X listings older than 30 days, clearance peaks in the middle of the follower range and collapses at the top.
| Follower band | X listings 30 days or older | Cleared | Clearance rate |
|---|---|---|---|
| Under 1,000 | 114 | 30 | 26.3% |
| 1,000 to 5,000 | 114 | 50 | 43.9% |
| 5,000 to 20,000 | 81 | 24 | 29.6% |
| 20,000 and up | 67 | 6 | 9.0% |
The 1,000 to 5,000 band clears at 43.9 percent, 4.9 times the rate of the 20,000 plus band. That is partly a restatement of the price finding, since bigger accounts carry bigger asks, and we cannot separate the two cleanly at this n. But it is the practical shape of demand here: mid four figure follower counts move, and the accounts sellers assume are premium sit longest. Run an account through the X follower rank tool before setting a number, and check its real interaction level with the engagement rate calculator, because a thin 50,000 follower account is the profile that stalls.
Buyers should read that in reverse. The bands with the most standing inventory are the bands where a buyer can push hardest on price, which is where categories like aged X accounts have depth.
Do 691 cancelled deals mean buyers walk away?
No, and this is the number most likely to be misread. There are 691 cancelled deals in the real set of 1,142 counted at 13:08 UTC on 2026-09-08, which looks like a 60 percent failure rate until you ask what a cancellation is mechanically. Half of them are a timer firing. This is a live ledger and it moves: two new deal threads opened in the 25 minutes while we were querying it.
| Cancellation type | Deals | Share of 691 | Median hours from open to cancel |
|---|---|---|---|
| Automatic cancel after 24 hours of inactivity | 351 | 50.8% | 29.2 |
| Closed with no reason recorded | 240 | 34.7% | 4.4 |
| Closed with a reason typed by a person | 100 | 14.5% | 18.2 |
The automatic cancellations are a housekeeping job closing an offer thread nobody replied to. Their median lifetime of 29.2 hours is the 24 hour threshold plus the sweep interval, exactly what a cron job produces rather than a decision. Calling those 351 rows abandoned purchases would be reading our own scheduler as buyer psychology.
The money layer settles it. Of the 691 cancelled deals only 55, or 8.0 percent, ever had funds held in escrow, and all 55 were refunded in full. The other 636 ended before a single cent moved. Only 19 of the 691 ever had credentials attached, so almost none reached the point where an account could have changed hands.
| Stage | Deals reaching it | Share of the 1,142 real deals |
|---|---|---|
| Deal thread opened | 1,142 | 100% |
| Opened as a priced offer rather than an inquiry | 743 | 65.1% |
| Escrow funded | 220 | 19.3% |
| Credentials delivered | 176 | 15.4% |
| Completed | 145 | 12.7% |
Once money is in escrow the picture inverts: 145 of 220 funded deals completed, 55 were cancelled and refunded, and 20 were still open on the day we measured. Seven deals in the whole real history are currently disputed. The funnel leaks at the top, in conversations that go quiet, not at the transfer.
How much of the price is actually negotiated?
Much less than the haggling reputation of this market suggests. We computed the ratio of price paid to price asked on each of the 145 completed deals: 101 closed at exactly the asking price and 44 closed away from it, all but a handful of those below. The median completed deal paid 100.0 percent of the ask, and the twenty fifth percentile paid 89.3 percent.
For roughly seven sales in ten there was no discount at all, and the quarter that did move most moved by about a tenth. The price you write when you create the listing is, in practice, the price. That is why the price band table matters more than any negotiation advice: here the ask is a filter on whether a buyer starts a thread, not an opening bid. Sellers who would rather have buyers arrive with a number can watch the wanted board of open buyer requests.
What share of each month's listings has cleared?
This is the cohort view, and it is the honest way to handle the fact that recent listings have had less time. Each row is the set of listings created in that month and the share of them that has a completed escrow deal as of 2026-09-08.
| Listing creation month | Listings created | Cleared by 2026-09-08 | Clearance rate | Still active |
|---|---|---|---|---|
| 2026-03 to 2026-05 | 47 | 13 | 27.7% | 7 |
| 2026-06 | 101 | 30 | 29.7% | 38 |
| 2026-07 | 257 | 60 | 23.3% | 123 |
| 2026-08 | 252 | 38 | 15.1% | 152 |
The August row is censored, not weak. That cohort has had at most 38 days of exposure against a median time to sale of 8.2 days and a ninetieth percentile of 33.6 days, so a large share of it has not had time to clear. The 141 listings created in September have had at most 8 days and have produced fewer than five completed sales between them, which is why there is no September row. The mature cohorts settle between 23 and 30 percent. For a seller creating a listing on the PlayerSells seller flow, that is roughly a one in four chance of a completed sale at the prices sellers actually chose. It is not a market wide success rate and we did not measure one.
Listings that leave without selling leave fairly quickly. There are 127 archived listings with no completed deal behind them, and the median gap between creation and archival is 18.3 days. Of those 127, 93 had received at least one priced offer before being pulled and 24 had reached escrow funding at some point. Withdrawal is not a synonym for nobody wanted it, and the ledger cannot tell us whether those sellers relisted, sold elsewhere, or changed their minds.
Three things we measured and then threw away
The listing view counter looked like a demand signal and is not. Among listings older than 30 days, the ones that sold had a median of 30 views against 57 for those that did not, which would suggest views predict failure. Normalise by days of exposure and it flips: 3.07 views per day for sold listings against 1.23 for still active ones. Both are artefacts of listing lifetime and feed position, because a sold listing stops accruing views the day it sells and new listings sit higher in the feed. We publish the reversal as a warning and neither direction as a finding.
Paid boosts could not be tested. Only 8 listings have ever carried a boost the seller paid for. The other 92 boost rows were granted at zero cost to platform owned inventory, so a boosted against unboosted comparison would mostly compare the platform's own listings against everyone else's. Eight is not a sample.
Auctions could not be tested either. The auction table holds 3 rows, all created on 2026-09-08, and the bid table is empty. Nothing in this article describes auction behaviour.
What this changes if you are listing an account this week
Set the expectation at weeks, not days. Half of everything that sold took longer than 8.2 days and a quarter took longer than 19.1 days, so a listing that is quiet after a week is behaving normally. The point where the data says something has gone wrong is nearer 30 days with no priced offer, because 55.7 percent of active listings past that mark have never had one.
Price is the lever that moves clearance, and it works at the moment of listing rather than in the conversation. A 34.4 percent clearance rate under $50 against 4.6 percent at $400 and up, across 471 listings with at least a month of exposure, is the biggest effect in this dataset, and the 69.7 percent of sales that paid full ask says you will not recover a high ask by negotiating down later.
Treat contact as the metric worth watching. The median sold listing got its first message 3.0 days in and took a single priced offer in its whole life. If a listing has been live a month with no thread, the constraint is discovery and price, not closing. Everything downstream of a funded escrow works: 145 of 220 funded deals completed and all 55 funded cancellations were refunded.
Questions sellers ask about time to sale
How long does it take to sell a Twitter account?
On our marketplace the median sale took 8.2 days from listing to escrow completion, measured across 145 completed sales between 2026-05-21 and 2026-09-07, of which 136 were listings on X, the platform most sellers still call Twitter. The quartiles for X are 4.8 and 18.6 days, and 6.2 percent of all sales closed within 24 hours. This is one marketplace with a small ledger, so treat it as a calibration point rather than an industry figure.
What share of listings ever sell?
For listing cohorts old enough to have had a fair chance, between 23.3 and 29.7 percent have a completed escrow deal. The 2026-06 cohort of 101 listings sits at 29.7 percent and the 2026-07 cohort of 257 listings at 23.3 percent. Newer cohorts are still censored. We did not measure a success rate for the account market as a whole and this number should not be read as one.
Does lowering my price make an account sell faster?
We can report association, not effect, because no account here was listed twice at two prices. Among 471 listings with at least 30 days of exposure, 34.4 percent of sub $50 asks cleared against 4.6 percent of asks at $400 or more, and the ranking holds inside X listings alone at 37.8 against 6.0 percent. Price is associated with whether a sale happens far more strongly than with how long it takes.
Is a cancelled deal a failed sale?
Usually not. Of 691 cancelled deals in our real ledger of 1,142, 351 were closed automatically after 24 hours of inactivity, with a median lifetime of 29.2 hours. Only 55 had ever been funded, and every one of those 55 was refunded. A cancellation on this platform is most often a message thread that went quiet before anyone paid, not a purchase that collapsed.
How much do buyers negotiate?
Less than expected. Of 145 completed sales, 101 paid the exact asking price and 44 paid something else, nearly all of them less. The median completed deal paid 100.0 percent of the ask and the twenty fifth percentile paid 89.3 percent. The negotiation that matters happens before a buyer opens a thread, in whether your number attracts one.
Which accounts sit longest?
Expensive ones and large ones. Among 376 X listings older than 30 days, clearance was 43.9 percent in the 1,000 to 5,000 follower band and 9.0 percent above 20,000 followers. Among all 471 listings of that age, clearance was 4.6 percent at asks of $400 and up. Eighteen percent of the active book has been live more than 60 days.
How fast does the escrow part actually run?
Fast. Across 220 escrow funded deals the median gap from the deal opening to funds being held was 0.28 hours, about 17 minutes. Across the 145 completed deals the median from escrow hold to completion was 19.6 hours, with a ninetieth percentile of 101.7 hours. Delivery and verification are not the slow part of selling an account. Finding the buyer is.
Why is your sample only 145 sales?
Because that is how many completed escrow deals exist. The deals table holds 1,212 rows, of which 70 are internal non transactional records and 997 are deals that never completed. We excluded the 70 by their signature: internal accounts on both sides, seven fixed prices with exactly ten deals each, and no credentials payload on any of them. Counting all 215 as sales would have overstated the real figure by 48 percent.
Related Articles
Continue learning with these related guides.
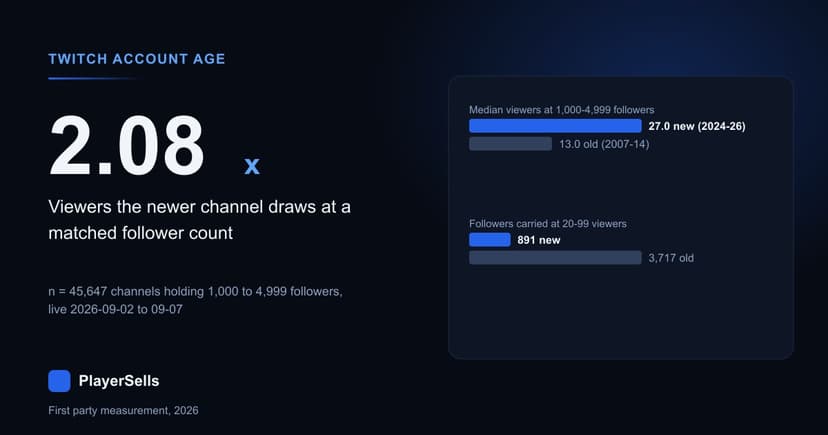
Does Twitch Account Age Still Matter? We Measured 432,192
Across 432,192 Twitch channels read on 2026-09-08, account age is almost pure accumulation, and at a matched follower count the newer channel wins.
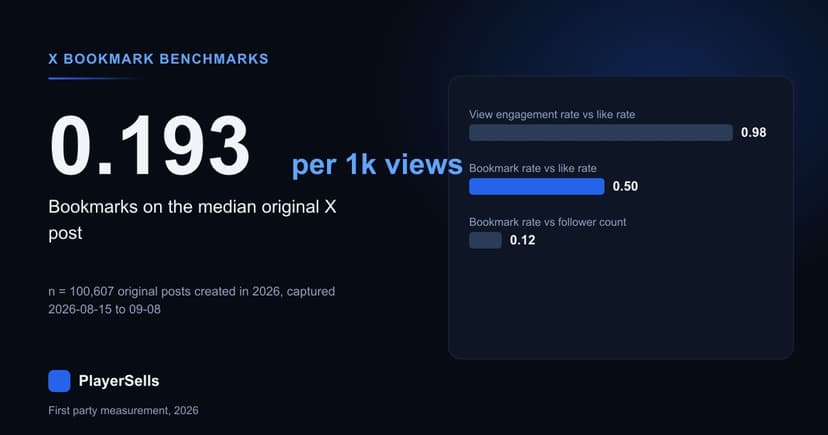
X Bookmark Rate Benchmarks From 94,318 Scored Accounts
Half the X accounts we scored on ten or more posts bookmark under 0.0273% of their views, and a third of original posts get no bookmarks at all.