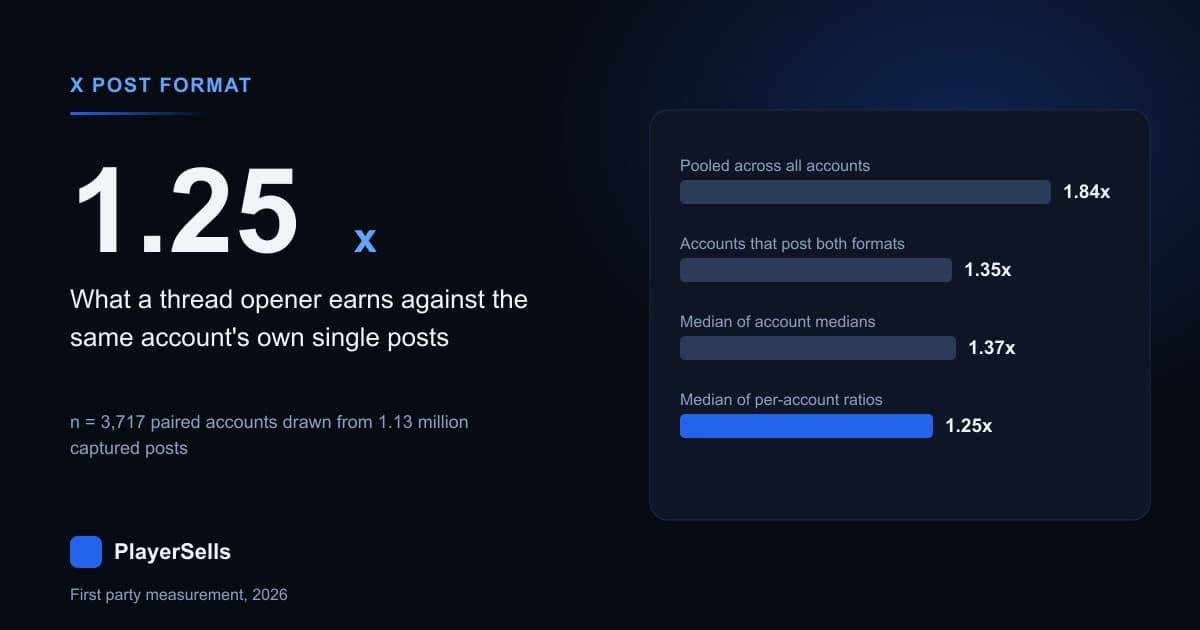
A thread opener on X earns a median of 1.25 times the engagement of the same account's own single posts. That is the within-account figure for 2026, measured across 3,717 accounts that posted at least three thread openers and at least three standalone posts, pulled from 1.13 million posts our X crawler captured between 2026-08-15 and 2026-09-08. The pooled figure, the one you get by lining up every thread opener against every single post regardless of who wrote it, is 1.84x. Both numbers are correct. Only one of them is about the format.
So the answer is yes, threads win, and they win by roughly half of what the pooled comparison advertises. In our capture the median thread opener took 147 engagements against 80 for the median single post. Restrict that comparison to accounts that post both formats and the gap falls to 1.35x. Compare each account only against itself and it falls again to 1.25x. The distance between 1.84 and 1.25 is not sampling noise. It is the fact that accounts which write threads are higher engagement accounts already, on every format they touch.
What counts as a thread in this data?
Engagement here means likes plus reposts plus replies plus quotes. A thread opener is a top level original post with at least one self reply chained beneath it in our capture. A single post is a top level original with no continuation. A continuation is a self reply sitting inside a thread.
Getting that classification right took a correction to our own tooling. The is_thread_root flag does not mean "top of a thread". It fires on any post that has a captured self reply beneath it, including posts that are themselves self replies. In our full table census of 6,326,562 rows, 219,570 posts carry the flag but only 174,126 are genuinely top level. Trusting the flag alone inflates the thread opener count by 26%.
Here is what the corpus is made of, counted exactly rather than sampled, across every row in the table on 2026-09-08. We exclude reposts from every comparison that follows, because a repost carries someone else's post and says nothing about the format its account chose.
| Post type | Posts | Share of corpus |
|---|---|---|
| Top level originals | 3,600,421 | 56.9% |
| Reposts of other accounts | 1,877,113 | 29.7% |
| Top level quote posts | 533,072 | 8.4% |
| Self reply thread continuations | 298,044 | 4.7% |
| Replies to other accounts | 17,895 | 0.28% |
Of those 3,600,421 top level originals, 155,932 open a thread, which is 4.33%. Threading is a minority behaviour at the account level too: 8,826 of the 29,301 accounts in our working slice, or 30.1%, opened at least one thread during the window. Our separate account scoring table agrees independently: of the 105,428 scored rows that carry a thread share value, 33,411, or 31.7%, carry a non zero one.
Why is the pooled number nearly double the within-account number?
Because a pooled comparison answers a different question. It asks which posts in the corpus get more engagement, and thread openers do, partly because of who writes them. The within-account comparison asks whether the same author does better when they open a thread. The gap between the two answers is worth more than either number alone.
We decomposed it in four steps on the same slice of 1.13 million posts. Each row narrows the comparison, and each narrowing costs the format some of its apparent advantage. The first row is what a pooled study reports; the last is what an author experiences when choosing between the two.
| Comparison | What it puts side by side | Ratio | Sample |
|---|---|---|---|
| Pooled, every account | 147 against 80 median engagement | 1.84x | 38,334 openers, 878,634 singles |
| Pooled, only accounts posting both | 142 against 105 median engagement | 1.35x | 30,436 openers, 194,553 singles |
| Median of per account medians | 173.0 against 126.5 | 1.37x | 3,717 accounts |
| Median of per account ratios | each account against itself | 1.25x | 3,664 accounts |
Watch the single post column. Across all accounts the median single post takes 80 engagements. Across only the accounts that also write threads it takes 105. That 31% lift on the format threads are being compared against is the composition effect, isolated. Thread writers are simply stronger accounts, on their single posts as much as on their threads.
One thing the composition is not: a size effect. The median follower count attached to a single post in our capture is 395,342, against 306,001 for a thread opener, so the single post pool skews to larger accounts rather than smaller. Whatever separates thread writers from the rest, it is not audience size. Our engagement calculator runs off the same scored accounts if you want to see how the two move together.
Of the 3,664 accounts with a usable baseline, 62.1% had a higher median engagement on their openers than on their own single posts. We then ran the identical analysis on each of the four quarters of the account space, split by hash prefix so the slices are disjoint. The within-account median ratio came back at 1.25x, 1.25x, 1.20x and 1.25x, on 3,664, 3,795, 3,662 and 3,608 paired accounts, with win rates between 59.6% and 63.5%. The finding does not depend on which accounts we happened to pull.
Does the thread advantage survive media, length and a likes-only test?
Mostly, and it shrinks in a way that tells you what part of the gain is really format. Thread openers are not written like single posts. In our sample 78.7% of openers carry media against 66.3% of single posts, and the median opener runs 165 characters against 128. If threads only won because their authors also attach images and write longer, holding those constant would kill the effect.
It does not. Every row below is a within-account comparison on the same slice, so each account is only ever compared against itself. Where a row names a stratum, both sides of the comparison sit inside that stratum: the media row weighs openers carrying images against single posts carrying images, and nothing else enters it.
| Comparison | Accounts | Share where the opener wins | Median ratio |
|---|---|---|---|
| All engagement, three of each format | 3,714 | 62.7% | 1.26x |
| Likes only, self replies removed | 3,714 | 59.0% | 1.20x |
| Views only | 3,675 | 63.4% | 1.14x |
| Posts with media only | 2,677 | 59.0% | 1.17x |
| Posts without media only | 744 | 60.5% | 1.19x |
| Posts of 200 characters or more | 1,389 | 59.3% | 1.17x |
| Posts under 200 characters | 2,225 | 63.8% | 1.31x |
| Replication on a disjoint account slice | 3,795 | 63.5% | 1.25x |
The likes-only row matters more than it looks. Engagement includes replies, and a thread opener collects the author's own continuations as replies, which mechanically inflates it. The median opener shows 4 replies against 2 for the median single post, so roughly one of those is the author. Strip replies out and compare likes alone and the advantage is still there at 1.20x. The self reply artifact is worth about six points of the ratio, not the whole thing.
Media and length each cost the format a little, and neither is decisive. Holding either constant drops the ratio from 1.26x to about 1.17x. Short openers, under 200 characters, show the largest advantage at 1.31x across 2,225 accounts, which is the opposite of the usual advice that an opener should be a dense paragraph.
How much engagement does the rest of the thread actually get?
This is the number nobody publishes and it is brutal. We reconstructed thread chains by walking self reply links inside our capture and compared each continuation against its own opener. Across 41,074 direct replies to an opener, more of them than there are openers because some openers carry several, the median one took 5.25% of its opener's engagement, 5.12% of its likes and 16.29% of its views.
| Post measured | Posts | Median share of opener engagement | Median share of opener views |
|---|---|---|---|
| Openers | 38,334 | 100% | 100% |
| Direct replies to an opener | 41,074 | 5.25% | 16.29% |
| Replies one step below that | 4,465 | 6.93% | 11.48% |
The two number columns tell different halves of one story. About one in six people who see the opener see the second post, and of that surviving sixth only a third as many like or reply. Distribution collapses first, interaction on top of it. The quartile range on view retention is wide, 8.66% to 29.84%, so some threads hold an audience far better than the median.
Aggregating the other way agrees. Each account's median continuation engagement over its own median opener engagement, across 3,826 accounts with at least three of each, gives 6.1%, quartiles 1.4% to 14.2%. A disjoint slice returned 6.7% across 3,918 accounts.
The practical reading: the opener is the product and the rest is documentation. If the payload of your thread is in post seven, our numbers say almost nobody is reading post seven. Anyone valuing an account's content output, through our tweet analyzer or by hand, should weight openers and continuations differently rather than counting posts.
Does account size change the answer?
Not much, which is the useful part. We split the paired accounts by the follower count attached to their captured posts and ran the identical within-account test inside each band. Follower count here is the value recorded at capture rather than at posting time, which is close enough given that the median post in this slice is under three weeks old.
Read the band labels loosely, because our crawl has a hole in the middle of the follower range. In a 10% block sample of the post store, 21,569 accounts sit between 78,000 and 100,000 followers and only 364 sit between 10,000 and 78,000: the scanner works down a follower ordered queue and has not reached the middle yet. The 10,000 to 100,000 row is in practice a 78,000 to 100,000 row.
| Follower band | Accounts | Share where the opener wins | Median ratio |
|---|---|---|---|
| Under 1,000 | 163 | 68.1% | 1.38x |
| 1,000 to 10,000 | 570 | 63.2% | 1.25x |
| 10,000 to 100,000 | 838 | 63.5% | 1.30x |
| 100,000 to 1,000,000 | 1,409 | 60.9% | 1.22x |
| 1,000,000 and above | 734 | 63.6% | 1.28x |
Every band lands between 1.22x and 1.38x, with win rates between 60.9% and 68.1%. The smallest accounts show the largest lift, though at 163 accounts that row carries the least weight; a disjoint slice put the same row at 1.17x. There is no size at which opening a thread stops helping, and none at which it helps dramatically. If you are sizing an account before a purchase, the follower tiers in our public X directory move the number far more than posting format does.
Do thread-heavy accounts really have lower engagement rates?
Less than our first cut said, and the correction is worth more than the original finding. Take every scored account at face value and heavy threaders look bad: under 10,000 followers, accounts threading 40% of the time show a median engagement rate 0.52 times that of same-band accounts that never thread. Then look at who is in the comparison group.
Accounts that never thread are not a clean baseline. Their median retweet share is 18.6%, against 0.0% for accounts threading 40% of the time, and a mostly retweeted timeline leaves our scorer only a handful of original posts to take a median over, which pushes the stored rate up. So we filtered both sides to accounts posting no more than 10% retweets, 40,478 of them, and rebuilt the table. Each cell is that group's median engagement rate divided by the median for never threading accounts in the same follower band, so 1.00 means no difference from a peer of the same size. Our engagement rate reproduces as median post engagement divided by follower count, matching exactly on 80,585 of the 94,471 scored rows carrying both.
| Follower band | Never threads | Under 5% threads | 5% to 15% | 15% to 40% | 40% or more |
|---|---|---|---|---|---|
| Under 10,000 (n=10,983) | 1.00 | 2.17 | 2.00 | 1.86 | 1.08 |
| 10,000 to 100,000 (n=11,262) | 1.00 | 1.88 | 1.88 | 1.56 | 1.33 |
| 100,000 to 1,000,000 (n=13,714) | 1.00 | 1.65 | 1.65 | 1.50 | 1.08 |
| 1,000,000 and above (n=4,519) | 1.00 | 0.44 | 1.44 | 1.56 | 1.19 |
The deficit mostly disappears. In three of four bands every thread share group now sits above its non threading peers, and the heaviest threaders land between 1.08 and 1.56 instead of 0.52. What survives is a shape rather than a slope: light and moderate threading sits highest, and the margin over a non threading peer narrows as threading becomes the main format. Two cautions. Adding a floor of ten sampled original posts on top of the retweet filter pushes the heaviest group back down, to between 0.89 and 1.50 by band, so that row is not settled. And the 1M and above line divides by a baseline median of 0.016%, coarse enough that its 0.44 should be read as noise.
All of that is cross-sectional, so it is association and not mechanism. What we can check is whether the within-account lift depends on how often an account threads. It does, cleanly: the accounts leaning hardest on the format extract least from it.
| Openers as a share of the account's top level posts | Accounts | Share where the opener wins | Median ratio |
|---|---|---|---|
| Under 5% | 255 | 71.8% | 1.51x |
| 5% to 15% | 1,607 | 62.7% | 1.28x |
| 15% to 40% | 1,347 | 61.2% | 1.21x |
| 40% or more | 508 | 61.6% | 1.20x |
An account that opens a thread rarely gets 1.51x on the ones it does open. An account that threads constantly gets 1.20x. The lift does not vanish, but three fifths of it goes as threading becomes routine, which is the direction the account level table points once its baseline is cleaned up.
What a thread opener looks like next to a single post
Format differences across the three post types are large. These are the 991,345 classified posts in our working slice, counted straight with no weighting by account, so a prolific poster contributes more rows than a quiet one.
| Post type | Posts | Carries media | Carries a link | Median characters | Over 240 characters |
|---|---|---|---|---|---|
| Thread opener | 38,334 | 78.7% | 12.5% | 165 | 32.1% |
| Single post | 878,440 | 66.3% | 30.5% | 128 | 23.4% |
| Thread continuation | 74,571 | 25.7% | 36.4% | 80 | 17.0% |
The link column is the one to read twice. Only 12.5% of openers carry a link, against 30.5% of single posts and 36.4% of continuations. People are moving the link into the tail of the thread, which is exactly where our decay numbers say the audience has already gone. A link at position four sits in front of roughly one in six of the people who saw you start. Continuations run short too, a median of 80 characters and 9 words: a thread here is one substantial opener followed by brief additions.
What our capture cannot tell you about threads
Our X corpus is a timeline crawl, not a firehose, and it has one limitation that kills an obvious analysis. Replies to other accounts make up 0.28% of the 6,326,562 posts we hold, far below any plausible real rate. That proves the timeline endpoint we read excludes most replies, which in turn means self reply chains reach us only partly. When we walked the chains, 88.5% of the threads we could reconstruct end to end were two posts long.
We are not publishing that as a fact about how long people write threads on X, because it is a fact about our capture. It is a floor. For the same reason we dropped a cut showing opener engagement falling with reconstructed thread length, and we report only positions two and three of the decay curve, where n is 41,074 and 4,465. Deeper positions fall to double digit counts and are truncation biased.
The truncation does not damage the headline. Genuine openers whose continuations we missed get filed as single posts, which contaminates the single post group with openers. Since openers score higher, that pushes the measured ratio down rather than up, so 1.25x is conservative. Age is not a confounder either: 94.2% of the top level posts in our slice were created in 2026, and the median opener and median single post are 19.3 and 17.7 days old.
What this means if you are buying or selling an X account
For a buyer, thread share describes a workflow rather than quality. An account whose posting is 40% or more openers is running a content operation. That operation does not carry the engagement penalty the unfiltered numbers suggest, but it is the harder thing to inherit, because the person who wrote those threads is not part of the sale. Our X account due diligence checklist covers what else to verify before money moves.
For a seller, the number to quote is opener performance, not post count. A 12 post thread is one post that mattered and 11 that reached about a sixth of the audience. Anyone valuing your account on total engagement across all posts will arrive at a figure your openers cannot support once they check. Accounts listed on our account marketplace that show consistent opener performance are easier to price than accounts that show volume.
For anyone planning content on a bought account, thread selectively. The lift is real at every size we measured and largest for accounts that use the format rarely. Our content planning tool is built around cadence rather than format, so treat 1.25x as a ceiling on what changing format alone can buy. If you are choosing between account types, the tradeoffs in aged X accounts and in large creator accounts matter far more than whether the previous owner wrote threads.
Common questions about threads on X
Do threads get more engagement than single tweets?
Yes, but by less than the internet claims. Comparing each account against itself across 3,717 accounts and 1.13 million posts captured between 2026-08-15 and 2026-09-08, the median thread opener earned 1.25 times the engagement of that account's own median single post, and 62.1% of accounts saw their openers beat their singles. The pooled comparison that ignores authorship says 1.84x, and about half of that is composition rather than format.
How many people read past the first post in a thread?
About one in six by views. Across 41,074 second posts measured against their own openers, the median second post received 16.29% of the opener's views and 5.25% of the opener's engagement, with a quartile range on views of 8.66% to 29.84%. Position three, measured on 4,465 posts, sat at 11.48% of opener views.
Do threads only win because they include images?
No. Openers do carry media more often, 78.7% against 66.3% for single posts in our slice. But holding media constant within each account, openers with media still beat single posts with media at 1.17x across 2,677 accounts, and openers without media beat singles without media at 1.19x across 744 accounts. Media explains part of the raw gap, not the effect.
What share of X posts are threads?
In our corpus of 6,326,562 posts captured through 2026-09-08, 155,932 of 3,600,421 top level original posts open a thread, which is 4.33%, and self reply continuations account for 298,044 posts, or 4.7% of everything. At the account level, 30.1% of the 29,301 accounts in our working slice opened at least one thread during the window.
Should I put my link in the thread opener or later?
Our measurement favours the opener and current practice does the opposite. Only 12.5% of openers carry a link against 36.4% of continuations, yet continuations reach a median 16.29% of the opener's views. Placing a link at position two or later puts it in front of roughly one sixth of the people who saw you start.
Does threading more often grow an account faster?
Our data shows no benefit from volume. Across 40,478 accounts with mostly original timelines, light and moderate threaders sit above their non threading peers on engagement rate in every follower band, while the heaviest threaders fall back toward that baseline at 1.08 to 1.56 times it. The within-account lift shrinks the same way, from 1.51x for light threaders to 1.20x for the heaviest. That is an association on one snapshot, not a demonstrated cause.
Is a high thread share a red flag when buying an account?
Treat it as a workflow signal, not a defect. A high thread share tells you the account ran on a content process that does not transfer with the login. On engagement rate it is close to neutral: once retweet heavy accounts are taken out of the comparison group, the heaviest threaders sit at 1.08 to 1.56 times their non threading peers rather than below them. What actually predicts whether a purchase works is closer to the ground covered in our breakdown of what a viral post really proves.
Related Articles
Continue learning with these related guides.
Does Twitch Account Age Still Matter? We Measured 432,192
Across 432,192 Twitch channels read on 2026-09-08, account age is almost pure accumulation, and at a matched follower count the newer channel wins.
X Bookmark Rate Benchmarks From 94,318 Scored Accounts
Half the X accounts we scored on ten or more posts bookmark under 0.0273% of their views, and a third of original posts get no bookmarks at all.