Telegram channels do not keep their view rate when they grow. In our own crawl of 8,202,041 daily channel rows collected between 2026-06-09 and 2026-09-02, we built a panel of 60,002 channels observed on at least 30 separate days and computed each channel's view rate as average post views divided by end-of-day subscribers. The median panel channel held a 10.6% view rate across the whole window. The channels that added 50% or more subscribers kept only 70% of their starting view rate, with the median falling from 10.5% to 7.8% across 1,104 channels. On Telegram in 2026, growth is what dilutes a view rate, not size.
The pattern is monotone and it comes with its own control group. Among the 28,726 panel channels whose subscriber count moved by less than 2% in either direction over the window, the median view-rate ratio between start and end was 0.9998, and exactly 50.04% of them declined. That is the coin flip a null group should produce. Every faster-growing bucket departs from it in the same direction, and the size of the departure rises with the growth rate.
What we measured and on how many channels
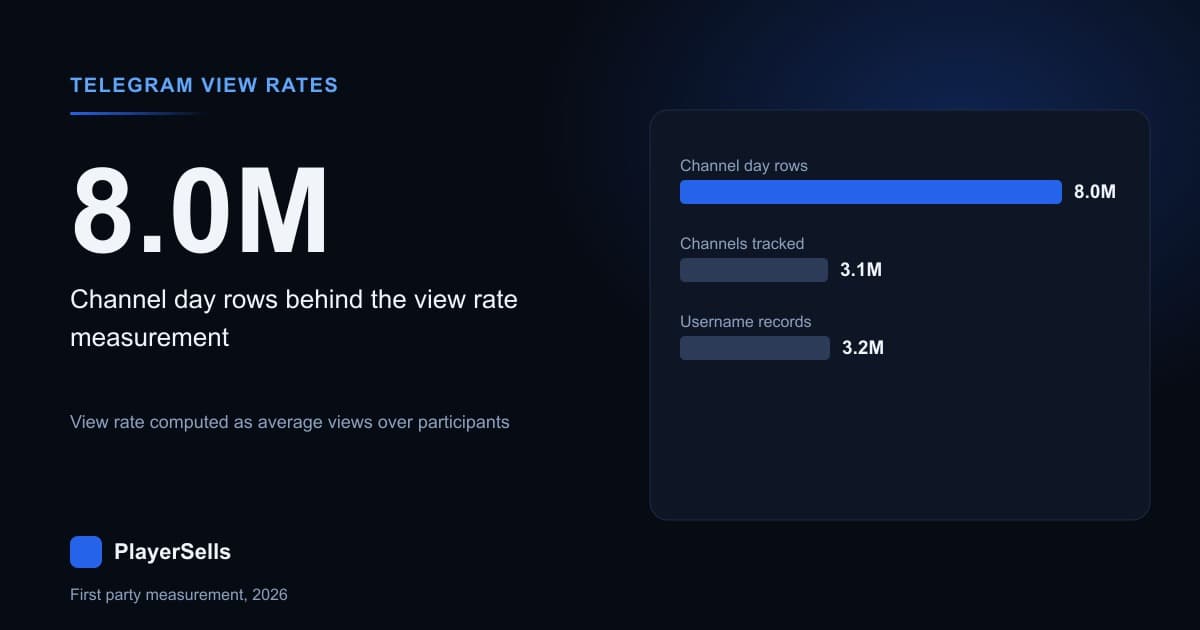
Our Telegram engine writes one row per channel per day it observes that channel: the chat id, the day, the end-of-day subscriber count, and the channel's average post views. We measured the table's size ourselves rather than trusting the planner estimate, which reports 8,005,227 rows against an actual 8,202,041. Those rows cover 3,101,861 distinct channels across 78 distinct days between 2026-06-09 and 2026-09-02, which is 78 of the 86 calendar days in that span.
Column coverage is uneven and it changes what is answerable. Average views is populated on 6,875,322 of 8,202,041 rows (83.8%), and it is never stored as zero: when the engine cannot read it, the value is null. Subscriber count is above zero on 8,109,914 rows (98.9%). The daily_growth and growth_pct columns are populated on only 5,041,202 rows (61.5%) and contain 247,560 exact zeros, so we discarded both. Every growth figure below is computed from the first and last subscriber readings we hold for that channel instead.
Per-day row volume is our crawler's schedule, not Telegram's activity. We recorded 374 rows on 2026-06-09, 157,469 on 2026-08-01, 36,839 on 2026-08-15 and 68,026 on 2026-09-02. Nothing in this article uses a raw daily total for that reason. Everything is a within-channel comparison, and each channel is compared only against itself.
How much of the directory can even answer this question?
Almost none of it, and that has to be said before any number. Of the 3,101,861 channels holding at least one row in the daily table, 2,789,593 appear on exactly one day. That is 89.93% of the directory with no trajectory at all, and no decay claim is possible about any of them. The deepest history we hold for any single channel is 68 days, not the full 78.
This table shows how many channels in our Telegram directory reached each depth of daily observation inside the 78-day window.
| Observed days per channel | Channels | Share of 3,101,861 |
|---|---|---|
| Exactly 1 | 2,789,593 | 89.93% |
| 2 or more | 312,268 | 10.07% |
| 10 or more | 145,903 | 4.70% |
| 20 or more | 88,626 | 2.86% |
| 30 or more | 70,089 | 2.26% |
| 50 or more | 38,676 | 1.25% |
| 60 or more | 21,919 | 0.71% |
Our panel is the 60,002 channels out of those 70,089 that also carry usable view and subscriber readings. The median panel channel was observed on 52 days across a 65-day span. It is a large-channel panel: median subscriber count at the start of the window was 28,737, and 59,997 of the 60,002 are broadcast channels rather than megagroups, which never carry post view counts at all. Only 10 panel channels started below 5,000 subscribers, so we make no claim in this article about small channels. Nothing here should be read as a benchmark for a 2,000-subscriber channel.
What is a normal Telegram view rate?
Before the growth question, the level. Measured across the last 10 observations we hold for each of the 60,002 panel channels, the median view rate was 10.58% of subscribers, and the distribution is wide enough that a single average is close to useless. The start-of-window and end-of-window ladders are nearly identical, which is the first sign that the aggregate distribution is stable even while individual channels move.
| Percentile | View rate, first 10 observations | View rate, last 10 observations |
|---|---|---|
| P10 | 1.66% | 1.61% |
| P25 | 4.34% | 4.21% |
| Median | 10.79% | 10.58% |
| P75 | 25.61% | 25.41% |
| P90 | 61.23% | 61.37% |
Two details in that ladder matter for anyone reading a seller's screenshot. First, 5.95% of panel channels ended the window with a view rate above 100% of their subscriber count, because Telegram post views include forwards, public web reads and non-subscriber traffic. A view rate is not capped at 100%, and a figure above it is not proof of fraud on its own.
Second, 29.15% of panel channels sit below a 5% view rate and 12.37% below 2%, which is the range where a subscriber count stops describing reach. The median panel channel showed 3,616 average views per post. For where a given channel sits against the wider directory, our Telegram channel rank tool and the Telegram channel directory both work off the same crawl.
Why is the cross-sectional ladder not a decay curve?
Sort the same panel by starting size and view rate falls hard. Channels that began between 5,000 and 25,000 subscribers ended at a median 13.55% view rate, while channels above 500,000 ended at 3.30%. That is a 4.1x gap. The industry reads that gap as decay and tells sellers their channel will lose reach as it grows. Our longitudinal data does not support that reading.
The right-hand column below is the one the cross-sectional story ignores: the median within-channel ratio of end-of-window view rate to start-of-window view rate, inside each size band.
| Subscribers at start of window | Channels | Median view rate at end | Interquartile range at end | Median within-channel ratio |
|---|---|---|---|---|
| 5,000 to 25,000 | 25,868 | 13.55% | 5.69% to 31.12% | 1.016 |
| 25,000 to 100,000 | 25,423 | 9.72% | 3.93% to 23.05% | 1.009 |
| 100,000 to 500,000 | 7,533 | 6.53% | 2.49% to 16.73% | 0.994 |
| Above 500,000 | 1,168 | 3.30% | 1.14% to 10.23% | 1.014 |
Across every band the typical channel finished the 78-day window with the view rate it started with. A 500,000-subscriber channel has a low view rate because of how it got there, not because this quarter cost it anything. That distinction is the whole reason a longitudinal cut was worth building, and it is why the static Telegram benchmark cut we published earlier should be read as a description of the population rather than a forecast for one channel.
How fast does view rate fall as subscribers arrive?
Splitting the panel by how much each channel's subscriber count actually moved produces a clean dose response. We measured start and end view rates as the median of each channel's first 10 and last 10 observations, so a single viral day cannot set either endpoint. The share-declining column counts channels whose end view rate came in below their start view rate.
| Subscriber change over window | Channels | Median change | View rate at start | View rate at end | Median ratio | Share declining |
|---|---|---|---|---|---|---|
| Below -10% | 3,583 | -16.71% | 4.91% | 5.74% | 1.196 | 32.5% |
| -10% to -2% | 14,800 | -3.74% | 8.70% | 8.65% | 1.043 | 41.5% |
| -2% to +2% | 28,726 | -0.49% | 11.83% | 11.61% | 0.9998 | 50.04% |
| +2% to +5% | 4,872 | +3.15% | 13.34% | 13.21% | 0.995 | 51.0% |
| +5% to +10% | 3,064 | +6.84% | 13.13% | 12.95% | 0.978 | 53.4% |
| +10% to +20% | 2,115 | +13.73% | 12.33% | 11.68% | 0.956 | 55.2% |
| +20% to +50% | 1,738 | +29.78% | 11.09% | 9.74% | 0.879 | 63.1% |
| +50% or more | 1,104 | +88.04% | 10.52% | 7.77% | 0.701 | 72.9% |
Both the median ratio and the share-declining column move in one direction across all eight buckets. Pooling everything above 20% growth gives 2,842 channels whose median view rate fell from 10.97% to 8.95%, a ratio of 0.820. Read the middle row as the calibration: at less than 2% subscriber movement, 50.04% of channels declined and the median ratio was 0.9998, which is what an unbiased measurement of no effect looks like.
How many views does a new subscriber actually bring?
Converting the cohort medians into an elasticity answers that directly. If subscribers rise by a factor S and view rate changes by a factor R, then views changed by S times R, and the elasticity is the log ratio of the two. The figures below are derived from the median rows in the table above.
| Subscriber change | Median subscriber change | Implied change in average views | Views elasticity |
|---|---|---|---|
| Below -10% | -16.71% | -0.4% | 0.02 |
| +5% to +10% | +6.84% | +4.5% | 0.67 |
| +10% to +20% | +13.73% | +8.7% | 0.65 |
| +20% to +50% | +29.78% | +14.0% | 0.50 |
| +50% or more | +88.04% | +31.8% | 0.44 |
A second and independent estimate agrees. Fitting a within-channel regression of log average views on log subscribers, one slope per channel across all of its observations, gives a median slope of 0.371 among the 13,352 panel channels whose subscriber count moved by at least 10% during the window, with an interquartile range of -0.50 to 1.70. Restricting only to channels that moved at least 2%, the median slope is 0.404 across 38,957 channels. Two methods that share no arithmetic put the marginal subscriber at somewhere between 0.37 and 0.50 of the average one, and the faster the growth, the lower the figure.
Is this just big channels getting bigger?
No, and the check is straightforward. Splitting the panel by starting size and then by whether each channel grew at least 20% produces the same penalty in every band. If size were driving the result, the ratio would differ across these three rows. It does not.
| Starting size | Flat or shrinking channels | Their median ratio | Channels that grew 20% or more | Their median ratio | Their share declining |
|---|---|---|---|---|---|
| 1,000 to 25,000 | 19,832 | 1.024 | 1,429 | 0.821 | 66.5% |
| 25,000 to 100,000 | 20,144 | 1.019 | 1,097 | 0.823 | 66.4% |
| Above 100,000 | 7,133 | 1.004 | 316 | 0.814 | 70.9% |
The three growth ratios land at 0.821, 0.823 and 0.814. A 12,000-subscriber channel that grew 20% and a 400,000-subscriber channel that grew 20% gave up almost exactly the same fraction of their view rate. The growth penalty is associated with the act of growing, not with the size the channel happens to be.
What happens when a channel loses subscribers?
The downside is the most useful half of the result and it is strongly asymmetric. Across the 3,583 panel channels that lost more than 10% of their subscribers, at a median loss of 16.71%, the median view rate went up 19.6%, from 4.91% to 5.74%. Work the arithmetic back and average views barely moved: a 0.4% decline in absolute views while 16.7% of the subscriber list left. The implied elasticity on the way down is 0.02.
The subscribers who leave a Telegram channel were, on the evidence of our panel, contributing almost nothing to its post views. That is the same conclusion the growth side points at from the other direction, and it sits alongside what we found measuring daily snapshots across platforms in the finding that most social accounts are shrinking. A subscriber count is a cumulative record of everyone who ever joined and never left. It is not a measure of an audience. Our engagement rate calculator is deliberately built on reach numbers rather than follower numbers for exactly this reason.
Could our own crawler have faked this result?
Three checks were run before publishing, and one of them is the reason we trust the headline. The null control is the strongest: the 28,726 channels with less than 2% subscriber movement returned a median ratio of 0.9998 and a 50.04% decline share. If our sampling imposed drift on view rates, that group would drift too.
Regression to the mean was tested and ruled out. Under mean reversion, the buckets with the highest starting view rate would fall the most. Ours do the opposite: the +2% to +5% bucket had the highest starting view rate of any bucket at 13.34% and its median ratio was 0.995, while the fastest-growing bucket started lower at 10.52% and fell to a ratio of 0.701. The ordering runs against reversion, not with it.
A measurement-lag artifact was also considered and rejected. If average views simply trailed the subscriber count, the distortion would be roughly proportional in both directions. It is not. Fast growers gave up 0.34 percentage points of view rate per point of subscriber gain, while shrinkers gained 1.17 points per point of subscriber loss, an asymmetry of 3.4x that no single lag length reproduces. The whole result was also verified twice with different endpoint definitions: single first and last observation days give cohort ratios of 1.049, 1.000, 0.992, 0.969 and 0.812, against 1.036, 0.998, 0.994, 0.972 and 0.820 from the 10-day medians published above.
What this means if you are buying a Telegram channel
Price the views, not the subscribers. A channel with 100,000 subscribers and a 3% view rate reaches fewer people than a channel with 30,000 subscribers and a 13% view rate, and our panel medians say the second profile is the more common one at that size. Anyone browsing live channel listings or a Telegram channel for sale should treat the subscriber figure as a header and the view rate as the number that determines what the asset does.
Ask for the growth history, then read it against these tables. A channel that added 50% or more subscribers in the last quarter is, in our measurement, the profile most likely to be carrying subscribers who do not view: 72.9% of that group declined in view rate, and 35.61% of the channels that grew at least 20% ended below a 5% view rate against 29.15% of the panel as a whole. A recent growth spurt on a Telegram channel is a reason to check the reach trend, not a premium feature.
Sellers get the mirror-image advice. A flat subscriber count with a stable view rate presents better under scrutiny than a spike, because the spike invites the buyer to test whether the new subscribers view anything. If you are preparing a channel to list, the reach trend is the evidence worth assembling, and the practical steps are covered in our guide to selling a Telegram channel safely before you put it in front of buyers.
What we could not measure
The panel cannot speak for small channels. Only 10 of 60,002 panel channels started with between 1,000 and 5,000 subscribers, because our crawler revisits large channels more often, so we dropped that band rather than publish a median of 10. The 2,789,593 single-observation channels are outside every claim here. We also hold no causal evidence: this is a before-and-after comparison of channels grouped by an outcome they selected into, so the honest statement is that fast subscriber growth is associated with a falling view rate, not that it causes one.
One internal correction came out of this work. The engine's own precomputed engagement_rate field on the channel record was documented as structurally empty. It is not: we found it non-zero on 10,039 of 58,751 channels in a 2% sample of the directory, 61,918 rows sampled in total, and on 59,366 of our 60,002 panel channels. Where it exists it agrees with the view rate we computed from scratch to within 0.8% at the median, which is a useful independent check on our own arithmetic. The is_scam and is_fake flags are genuinely dead at zero true values across all 61,918 sampled rows, and 0.22% of sampled channels carry Telegram verification.
Questions buyers and sellers ask about Telegram view rates
The answers below all come from the same 60,002-channel panel measured between 2026-06-09 and 2026-09-02, unless stated otherwise.
What is a good Telegram channel view rate in 2026?
The median in our panel of 60,002 channels was 10.58% of subscribers, with a quartile range of 4.21% to 25.41%. Size shifts the target sharply: a median 13.55% for channels of 5,000 to 25,000 subscribers, 9.72% at 25,000 to 100,000, 6.53% at 100,000 to 500,000, and 3.30% above 500,000. Judge a channel against its own size band, not against a single platform-wide average.
Does adding subscribers quickly lower a Telegram channel's view rate?
In our data it is strongly associated with it. Channels that grew at least 20% over the 78-day window ended with a median view-rate ratio of 0.820 across 2,842 channels, and those that grew 50% or more ended at 0.701 across 1,104 channels. Channels whose subscriber count moved less than 2% ended at 0.9998. We cannot prove a mechanism, only that the association is monotone across all eight growth buckets.
Can a Telegram view rate be above 100%?
Yes, and 5.95% of our 60,002 panel channels finished the window above it. Telegram counts post views from forwards, public web previews and non-subscribers, so a channel whose posts travel outside its own subscriber list can read above 100%. A view rate above 100% is not evidence of manipulation on its own, and any view rate above 61.37% puts a channel in the top decile of our panel.
How many days of history do you need before a view-rate trend means anything?
More than most channels have. In our directory, 89.93% of 3,101,861 channels appear on exactly one day, and only 2.26% reach 30 observed days. We required 30 days before letting a channel into the panel, and the median panel member carries 52 observations across a 65-day span. A two-week screenshot cannot separate a trend from a single strong post.
Do channels lose views when subscribers leave?
Barely. Across 3,583 panel channels that lost more than 10% of subscribers, at a median loss of 16.71%, absolute average views fell 0.4% and the view rate rose 19.6%. The implied elasticity of views to subscribers on the way down is 0.02. Departing subscribers, in our measurement, were contributing almost no views before they left.
What should I ask a seller for before buying a Telegram channel?
Two series rather than two numbers: the subscriber count over time and the average post views over time, ideally 30 days or more, since 89.93% of channels in our directory have no observable history at all. Then compute views over subscribers yourself for the first and last week and compare the ratio. A ratio near 1.0 with a flat subscriber count is the normal case in our panel, where 50.04% of steady channels declined.
Related Articles
Continue learning with these related guides.
Does Twitch Account Age Still Matter? We Measured 432,192
Across 432,192 Twitch channels read on 2026-09-08, account age is almost pure accumulation, and at a matched follower count the newer channel wins.
X Bookmark Rate Benchmarks From 94,318 Scored Accounts
Half the X accounts we scored on ten or more posts bookmark under 0.0273% of their views, and a third of original posts get no bookmarks at all.