
Crypto Telegram Channels Are Shrinking: 86% Lost Subscribers
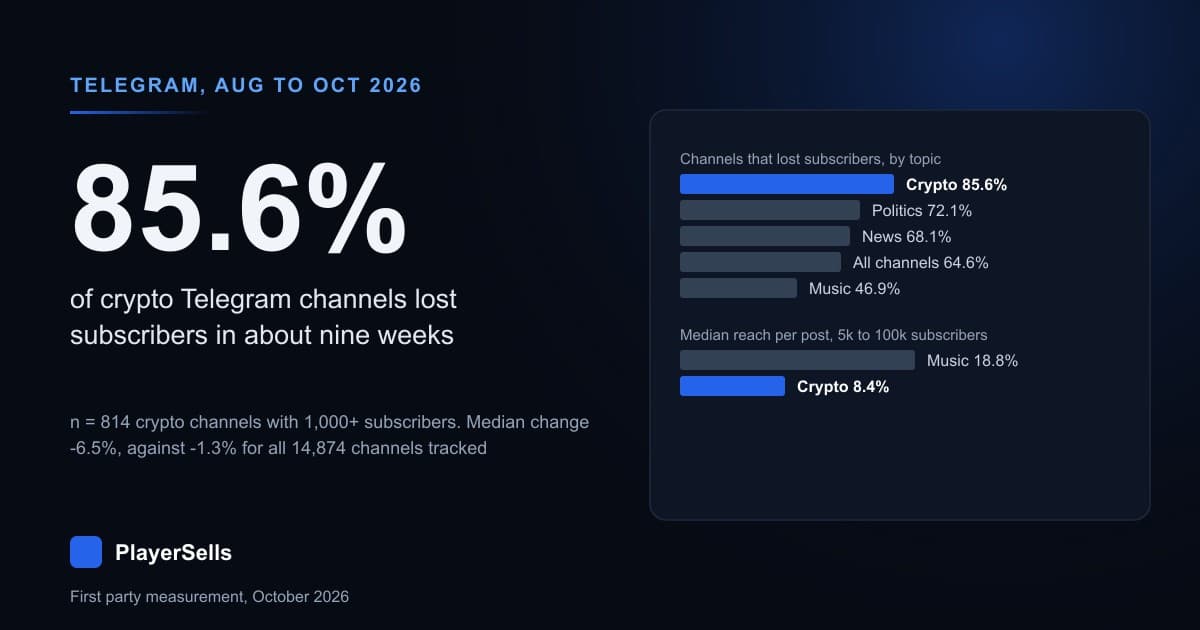
85.6% of 814 crypto Telegram channels lost subscribers from early August to early October 2026, against 46.9% of music channels. Reach data included.
Crypto Telegram channels are losing subscribers faster than any other large topic we track. Of 814 crypto channels that had at least 1,000 subscribers in the first week of August 2026, 85.6% had fewer subscribers by late September or early October, and the median channel was down 6.5%. Across every channel in the same panel, 64.6% shrank and the median change was -1.3%. Music channels, the healthiest category in the panel, split almost evenly: 46.9% shrank and the median one grew 0.7%.
The same crypto channels also reach a smaller share of their audience with each post. Among channels of 5,000 to 100,000 subscribers, the median crypto channel's average post is seen by 8.4% as many people as it has subscribers. A music channel of the same size reaches 18.8%. This page publishes both measurements, the sample behind every number, and what the data cannot tell you. All figures come from PlayerSells' own Telegram crawler and were read on October 3, 2026.
How many crypto Telegram channels lost subscribers between August and October 2026?
85.6% of the crypto channels we tracked lost subscribers between August and October 2026. The panel holds 814 Telegram channels that our classifier labels crypto and that had at least 1,000 subscribers at their first daily reading in the window August 1 to 7, 2026. We compared that reading with each channel's last reading between September 26 and October 2, 2026, a median of 62 days later. 697 of the 814 channels ended lower than they started, and 117 ended higher. The median crypto channel lost 6.5% of its subscribers. A quarter of them lost more than 9.4%, and even the channel at the 75th percentile was down 3.2%, which means three in four crypto channels lost at least 3% of their audience in about two months. These are mostly large channels: the median crypto channel in the panel started with 178,624 subscribers.
How does crypto compare with other Telegram categories?
Crypto is the worst performer of every topic with enough channels to measure, and by a wide margin. The table covers every category with at least 150 channels in the panel, plus the channels our classifier could not label. Politics and news come next, with roughly seven in ten channels shrinking. Education matches the panel as a whole. Music is the only category where more channels grew than shrank.
| Category | Channels | Lost subscribers | Gained subscribers | Median change |
|---|---|---|---|---|
| Crypto | 814 | 85.6% | 14.4% | -6.50% |
| Politics | 179 | 72.1% | 27.9% | -1.82% |
| News | 730 | 68.1% | 31.9% | -1.42% |
| Education | 602 | 64.8% | 35.2% | -1.06% |
| Not classified | 11,403 | 63.0% | 37.0% | -1.10% |
| Music | 213 | 46.9% | 53.1% | +0.74% |
| All channels | 14,874 | 64.6% | 35.4% | -1.26% |
Telegram channels with at least 1,000 subscribers at the first reading (August 1 to 7, 2026), compared with their last reading (September 26 to October 2, 2026). Categories with fewer than 150 channels in the panel are not shown.
A 6.5% median loss in roughly nine weeks is large for an established channel. On the panel as a whole the typical channel lost about 1.3%, so the median crypto channel shrank about five times as fast as the median channel overall. Shrinking is normal on Telegram in this period, which our earlier study of six million daily snapshots also found for June and July. Crypto stands out because the loss is both more common and deeper.
Is crypto shrinking only because its channels are bigger?
No. Crypto channels shrink more than other topics at every channel size we can test. Bigger Telegram channels do lose subscribers more often: in the full panel, 57.8% of channels that started between 10,000 and 100,000 subscribers shrank, against 68.2% between 100,000 and 1 million and 70.0% above 1 million. Crypto channels in the panel also start larger than average (median 178,624 against 121,871 for all channels). So we split each category by starting size. The gap survives every split.
| Starting size | Crypto: lost subscribers | News | Education | Music |
|---|---|---|---|---|
| 1,000 to 100,000 | 75.3% (n=190) | 57.6% (n=210) | 57.4% (n=209) | 41.0% (n=83) |
| 100,000 to 1 million | 87.7% (n=530) | 72.8% (n=470) | 68.6% (n=388) | 51.6% (n=126) |
| Over 1 million | 94.7% (n=94) | 68.0% (n=50) | too few | too few |
Among crypto channels above 1 million subscribers, 89 of 94 lost subscribers, and the median one lost 9.4%. In the 100,000 to 1 million band, where crypto, news and education all have several hundred channels, crypto's shrink rate is 15 points higher than news and 19 points higher than education. Size makes shrinking more likely on Telegram in general, but it does not explain the crypto result.
Do crypto channels also reach fewer of their subscribers?
Yes. At the same size, a crypto channel's average post is viewed by fewer people per subscriber than in almost any other category. We measure reach as a channel's average views per post divided by its subscriber count, and compare categories only among channels of 5,000 to 100,000 subscribers so that size does not drive the result. The median crypto channel there reaches 8.4% (n=2,712). Music reaches 18.8%, programming 17.0% and gaming 14.3%. Only sports, finance and deal channels sit lower. Posting volume is not the explanation. In the same size range the median crypto channel posts 1.1 times a day, almost the same as music at 1.0, and the two have similar median sizes (23,089 and 19,931 subscribers). News and sports channels, which post six to seven times a day, would be expected to reach a smaller share per post; crypto channels reach as little while posting far less.
| Category (5k to 100k subscribers) | Channels | Median reach per post |
|---|---|---|
| Music | 423 | 18.8% |
| Programming | 327 | 17.0% |
| Anime | 379 | 14.9% |
| Gaming | 377 | 14.3% |
| Tech | 504 | 12.6% |
| Education | 2,347 | 11.7% |
| Politics | 646 | 10.5% |
| News | 2,660 | 8.7% |
| Crypto | 2,712 | 8.4% |
| Finance | 455 | 7.7% |
| Sports | 667 | 7.7% |
| Deals | 207 | 5.9% |
Telegram channels with 5,000 to 100,000 subscribers whose public page our crawler read between August 4 and October 3, 2026, with a topic label and a measured view count. Selected categories with at least 200 channels. These are the same figures as the October 2026 edition of our Telegram engagement rate benchmark.
The gap with music holds inside narrower size bands too. Between 5,000 and 20,000 subscribers, crypto channels reach a median 10.4% (n=1,157) against 25.7% for music (n=212). Between 20,000 and 100,000, crypto reaches 7.4% (n=1,555) against 16.0% for music (n=211). In those narrower bands crypto sits level with news (10.2% and 7.8%), even though news channels post three to five times as often.
How does reach change with channel size across Telegram?
Reach falls steadily as channels grow, from 27.5% of subscribers per post at 1,000 to 5,000 subscribers to 3.1% above 500,000. This is the full population behind the category comparison: 139,115 Telegram channels with at least 1,000 subscribers and a measured view count, whose public page our crawler read between August 4 and October 3, 2026. The spread inside each band is wide, so the table also shows the middle half of channels (25th to 75th percentile).
| Subscribers | Channels | Median reach per post | Middle half | Median views per post |
|---|---|---|---|---|
| 1,000 to 5,000 | 43,605 | 27.5% | 10.4% to 68.1% | 544 |
| 5,000 to 20,000 | 44,234 | 14.0% | 5.5% to 34.6% | 1,705 |
| 20,000 to 100,000 | 41,428 | 9.6% | 3.8% to 23.6% | 3,638 |
| 100,000 to 500,000 | 8,625 | 5.9% | 2.2% to 16.4% | 10,117 |
| 500,000 and up | 1,223 | 3.1% | 1.1% to 10.1% | 31,836 |
| All channels | 139,115 | 14.5% |
One channel in ten (10.1%) shows more average views than subscribers. That is usually forwarding or paid promotion bringing in readers from outside the channel, and it is more common among small channels. Our Telegram channel benchmarks from July 2026 measured the same ratio on an earlier snapshot of a larger index and found 31.3% at 1,000 to 5,000 subscribers and 3.3% above 500,000. The October figures are a little lower at both ends. We would not read a trend into that: the two snapshots cover different sets of channels, and the July table used different size bands in the middle.
Why are crypto Telegram channels losing subscribers?
This data does not say why, and we do not claim a cause. It records subscriber counts and view counts, not who left or what they did next. Several explanations fit the numbers and we could not separate them. Telegram deletes accounts that stay inactive for a set period, which can lower subscriber counts, and that would hit hardest the channels that grew through bulk or bought subscribers. Interest in crypto content also rises and falls with crypto prices, and we did not test whether this period's losses follow the market. Some of the loss may also come from channels that post less and are slowly being abandoned. Each of these would produce falling counts; none can be confirmed from this panel. What the data does show is that the decline is concentrated in crypto, holds at every channel size, and coincides with the lowest per-post reach among the larger categories. If you are judging a specific crypto channel, compare its recent subscriber trend and its views per post with the figures above rather than with its headline subscriber count. Our crypto Telegram channel directory shows both for individual channels.
How we measured
Subscriber change. Our crawler stores a daily subscriber reading for the Telegram channels it tracks closely. For each channel we took its first reading between August 1 and 7, 2026 and its last reading between September 26 and October 2, 2026, and kept channels with at least 1,000 subscribers at the first reading. Groups were excluded; only broadcast channels count. That leaves 14,874 channels. The two readings are a median of 62 days apart. A channel "lost subscribers" if its last reading is lower than its first.
Reach per post. For each public channel the crawler reads the public web preview at t.me, averages the view counts shown on the most recent posts, and divides by the subscriber count. The reach tables use channels (not groups) with at least 1,000 subscribers, a view count above zero, and a public page read between August 4 and October 3, 2026: 139,115 channels, read on October 3, 2026 at 14:29 UTC. The posting-rate and narrower-band figures in the reach section come from a second read of the same population about 15 minutes later.
Categories. Topic labels come from a keyword classifier that reads each channel's name and description. A phrase scores more than a single word, and channels with no clear match stay unlabeled. In the subscriber-change panel, 3,471 of 14,874 channels carry a label; the rest appear as "Not classified".
Medians. Every central figure is a median, because Telegram subscriber counts and view counts are highly skewed and a few very large channels would dominate an average.
Limitations
- The subscriber-change panel is made of large channels. The filter is 1,000 subscribers, but our daily tracking concentrates on bigger channels: only 27 of the 14,874 started below 10,000 subscribers, and the median channel started with 121,871. The shrink rates describe established channels, not new or small ones.
- The panel is not a random sample of Telegram. Our crawler finds public channels through links, forwards and listings, so private channels and channels nobody links to are missing.
- Category labels are approximate. They come from names and descriptions, and about three quarters of the panel has no label. A mislabeled channel moves between rows of the table.
- Reach is a snapshot. Average views are read from the most recent posts on the public preview, including posts that are still collecting views, so a channel that posts many times a day can read lower than its settled reach.
- Two months is short. The comparison covers about nine weeks. It describes that period and is not a forecast.
- No cause is measured. See the section above.
Frequently asked questions
Are crypto Telegram channels losing subscribers?
Yes, in our data most are. Between early August and early October 2026, 85.6% of 814 tracked crypto channels with at least 1,000 subscribers lost subscribers, and the median one lost 6.5%. Across all 14,874 channels in the same panel, 64.6% shrank and the median lost 1.3%.
What is a good view rate for a crypto Telegram channel?
For a crypto channel of 5,000 to 100,000 subscribers, the median average post is viewed by 8.4% as many people as the channel has subscribers (n=2,712, October 2026). A channel well above that is outperforming its category; a channel far below it, especially with a large subscriber count, deserves a closer look at where its subscribers came from.
Which Telegram channels are still growing?
Music channels did best in our panel: 53.1% of 213 music channels gained subscribers between August and October 2026, and the median one grew 0.7%. Smaller channels also shrank less often than large ones, although our tracking panel holds few channels under 10,000 subscribers.
Is a falling subscriber count a sign of fake subscribers?
Not on its own. Telegram deletes long-inactive accounts, so a channel that bought subscribers can lose them over time, but a real channel also shrinks when readers leave. Compare the decline with views per post: a large channel whose posts reach only a small fraction of its subscribers is more likely to be carrying inactive accounts.
For channel-level numbers, browse the Telegram channel directory, which lists subscriber counts and views per post for the channels behind this study.
Free tools for this topic

Published by the PlayerSells editorial team. Data comes from PlayerSells marketplace records and our own crawlers. About PlayerSells · Editorial policy
Related Articles
Continue learning with these related guides.
Kick and Twitch Simulcasts: 83% of Viewers Watch on Twitch
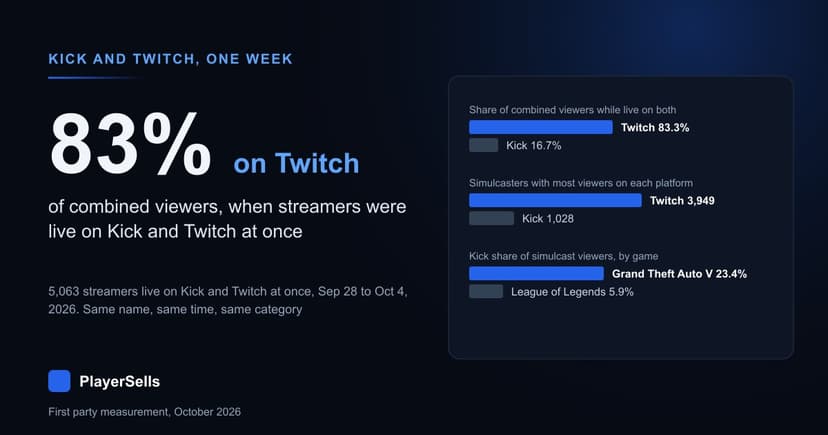
5,063 streamers went live on Kick and Twitch at once from Sep 28 to Oct 4, 2026. Twitch drew 83% of their combined viewers and Kick 17%.
How Much of Kick Is Gambling? One Week vs Twitch
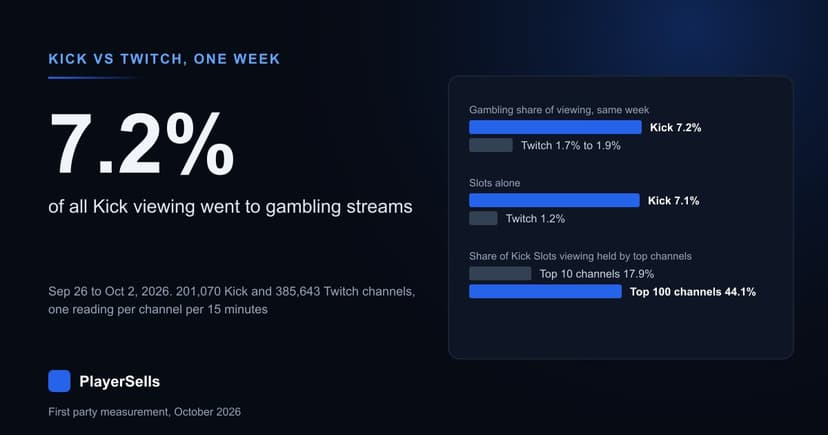
Gambling took 7.2% of Kick viewing from Sep 26 to Oct 2, 2026, across 201,070 channels. Twitch's gambling categories took 1.7% to 1.9% the same week.
X Premium Linked to 1.6x-1.8x More Reach at the Same Size
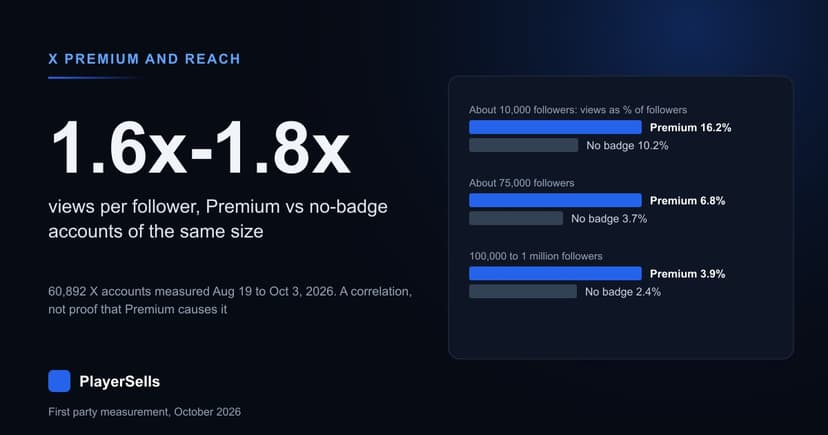
Across 60,892 X accounts, Premium posts drew 1.6x to 1.8x the views per follower of no-badge accounts the same size. A correlation, not proof of cause.